PEPE Price: Analyst Says Watch This Level To Trigger 400% Move Toward $0.0001


Meme coin PEPE has been hovering near a crucial support level over the past few weeks, following a sustained decline that began at the start of the year. Interestingly, a crypto analyst on TradingView has highlighted this price support as a make-or-break level for PEPE, suggesting that a breakout above this zone could spark a 400% rally toward $0.0001. This outlook comes after a particularly challenging week for the entire crypto market, during which PEPE extended its losses and dropped to its lowest price point in months.
This Level To Trigger 400% Move For PEPE
Technical analysis shows that PEPE’s upward trajectory hinges on a bounce at support around $0.00000650. This interesting analysis was highlighted by a crypto analyst on the TradingView platform using the PEPE weekly candlestick timeframe chart.
This support level comes into play in light of PEPE’s extended decline since the beginning of the year. Interestingly, technical analysis shows that the decline looks like a repeating pattern of the meme coin’s price action in 2024. The ongoing correction stems from PEPE’s peak price of $0.00002803 in December 2024, which the analyst termed the third drive. Notably, earlier first and second drives in 2024 were also each accompanied by a correction phase after rallies.
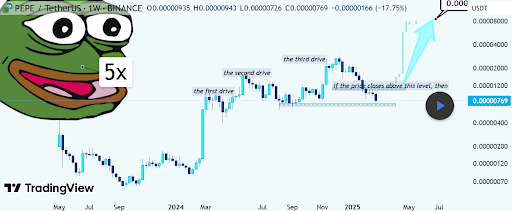
Interestingly, the meme coin has shown signs of life in the past 24 hours with a push above this support level and climbing into the $0.000007 range. However, the uptrend could not be defined yet, and the crypto analyst noted that any uptrend will depend on how PEPE reacts with a crucial resistance zone between $0.00001150 and $0.00001200.
This level has previously acted as support but has now turned into resistance. Therefore, a weekly close above this zone would confirm a bullish breakout and a potential trend reversal from bearish to bullish.
Price Targets If The Meme Coin Breaks Above Resistance
A break above $0.00001200 would cement a breakout with more momentum for PEPE. Such a breakout would mark the first bullish catalyst in a while, confirm momentum, and lead to increased buy-side pressure with an aggressive upward move. From here, the next resistance levels are projected to be around $0.00001700 to $0.00002200. A move to $0.00002200 will most likely cascade into more momentum above its current all-time high of $0.00002803.
The analyst further predicted a price target of $0.0001, provided the bullish momentum sustains itself. However, failure to close above the key resistance level at $0.00001200 could result in a continued downtrend, with PEPE possibly retesting lower support zones around $0.00000650 to $0.00000550.
At the time of writing, PEPE is trading at $0.000007239, up by 4.4% in the past 24 hours. PEPE’s ability to sustain such an upward trajectory would depend on broader market conditions for Bitcoin and other large market cap cryptocurrencies.