Cardano Price Forecast: ADA corrects after 70% surge following Trump’s endorsement to Crypto Strategic Reserve

- Cardano price trades down by 11.5% on Monday after rallying 72.15% the previous day.
- US President Donald Trump’s announcement of a US ‘Crypto Strategic Reserve’ boosted ADA price.
- On-chain and technical outlook suggest a rally continuation as ADA’s open interest and trading volume rise.
Cardano (ADA) price trades down by 11.5%, around $1 at the time of writing on Monday, after rallying more than 70% the previous day. US President Donald Trump’s announcement on his Truth Social platform of a US ‘Crypto Strategic Reserve’ boosted Cardano’s price on Sunday. On-chain and technical outlook suggest a rallyicontinuation as ADA’s open interest and trading volume rise.
Donald Trump’s announcement of ‘Crypto Strategic Reserve’ boosts Cardano price
US President Donald Trump announced on his Truth Social platform on Sunday a US ‘Crypto Strategic Reserve,’ including Bitcoin (BTC), Ethereum (ETH), XRP (Ripple), Solana (SOL), and Cardano (ADA), aiming to boost America’s crypto leadership.
He wrote: “A US Crypto Reserve will elevate this critical industry after years of corrupt attacks by the Biden Administration, which is why my Executive Order on Digital Assets directed the Presidential Working Group to move forward on a Crypto Strategic Reserve that includes XRP, SOL, and ADA. I will make sure the US is the Crypto Capital of the World. We are MAKING AMERICA GREAT AGAIN!”
Cryptocurrency valuations leaped upward after this announcement, with Cardano rallying more than 70% that day.
Cardano Price Forecast: Bulls aiming for the $1.32 mark
Cardano price broke above a descending trendline (drawn by connecting multiple highs since mid-January) on Sunday and rallied 72.15%. When writing on Monday, it trades slightly down around $1.
If Cardano continues its upward momentum, it could extend the rally to retest its December high of $1.32.
The Relative Strength Index (RSI) on the daily chart reads 67, above its neutral level of 50, indicating a strong bullish momentum. Moreover, the Moving Average Convergence Divergence (MACD) indicator also shows a bullish crossover on Sunday, giving a buy signal and suggesting an upward trend.
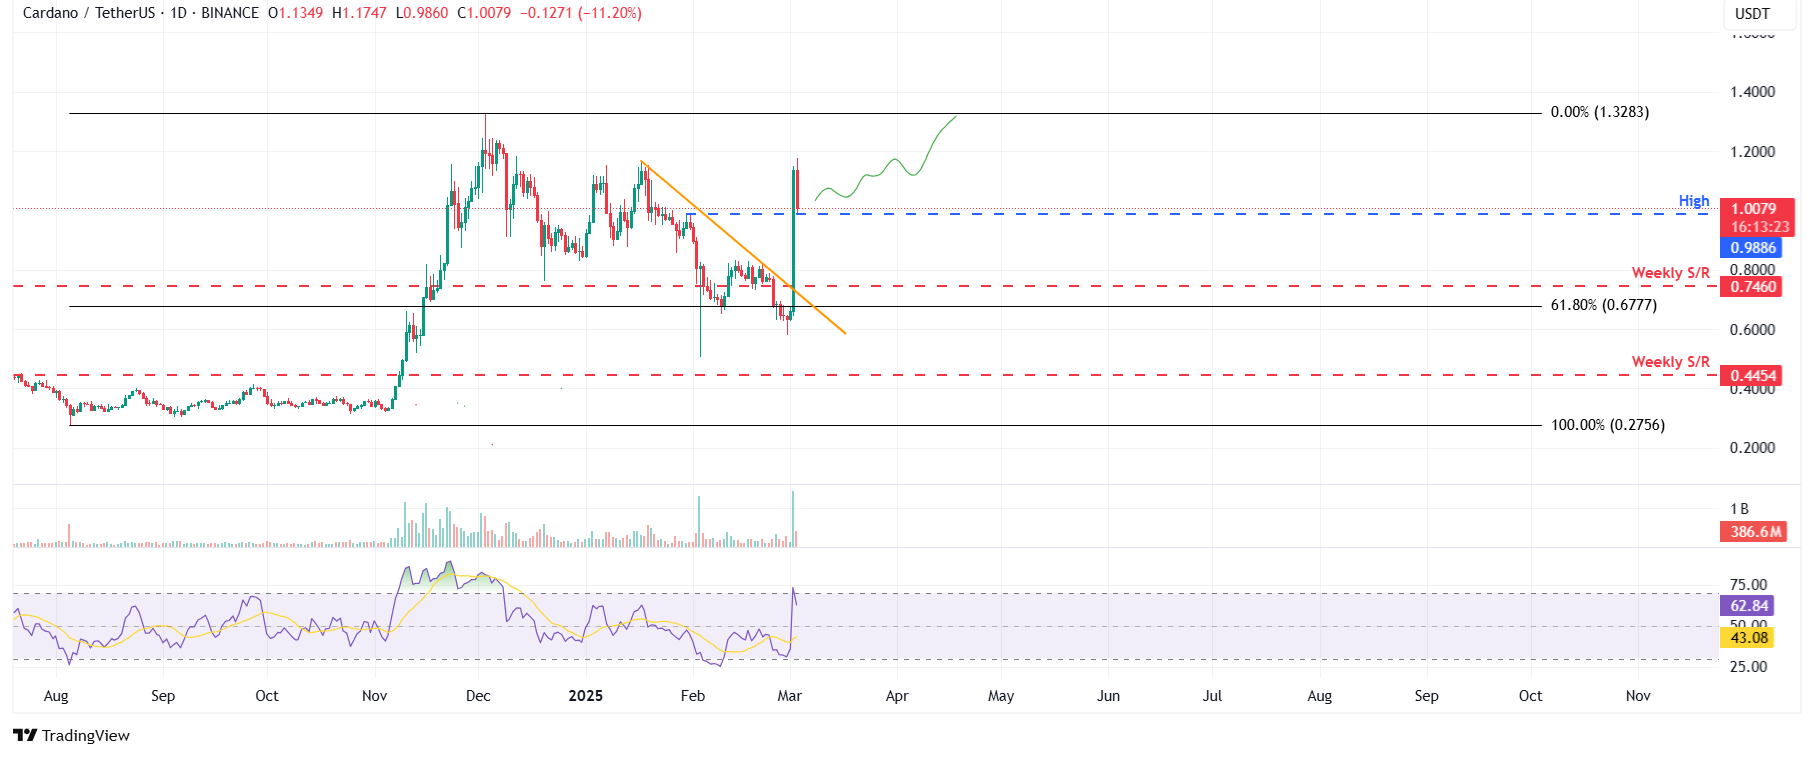
ADA/USDT daily chart
Cardano’s Open Interest (OI) further supports the bullish outlook. Coinglass’s data shows that the futures’ OI in ADA at exchanges rose from $536 million on Saturday to $1.18 billion on Sunday, the highest level since early February. An increasing OI represents new or additional money entering the market and new buying, which suggests a rally ahead in the ADA price.
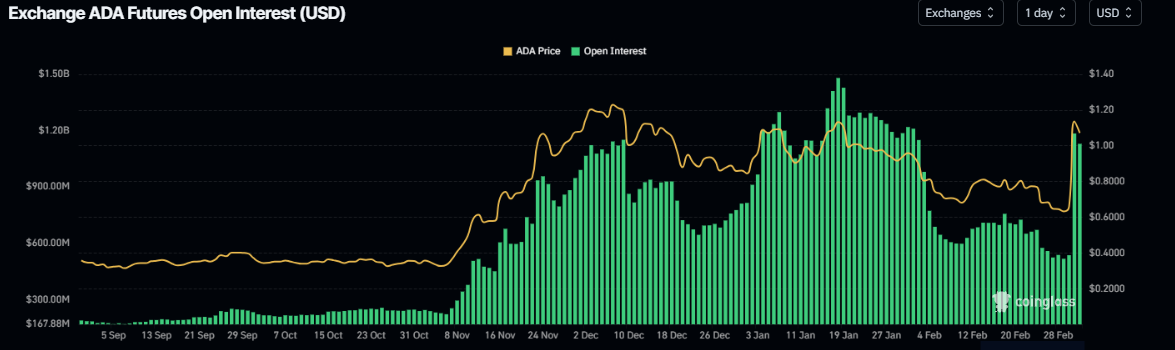
Cardano Open Interest chart. Source: Coinglass
Another factor bolstering the platform’s bullish outlook is a recent surge in traders’ interest and liquidity in the ADA chain. Artemis data shows that ADA Chain’s trading volume rose from $536.9 million on Saturday to $8.4 billion on Sunday, the highest since September 2021.
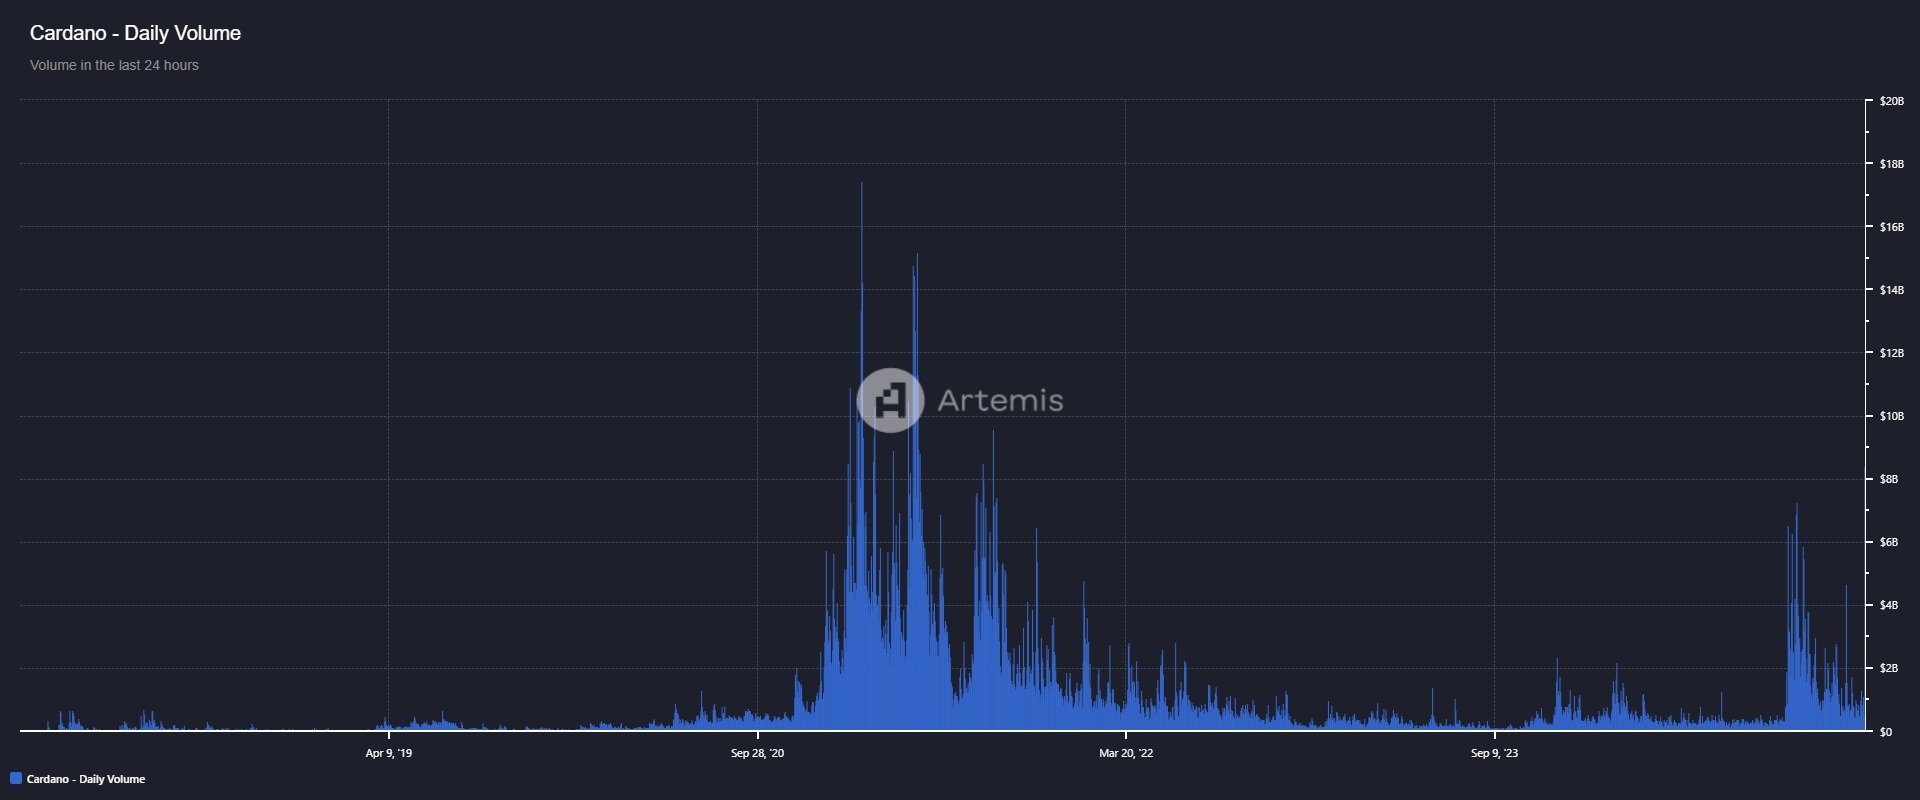
Cardano trading volume chart. Source: Artemis