Sui Price Forecast: SUI technical outlook hints at a possible double-bottom formation


- Sui price action hints at a double-bottom technical formation, which tends to be followed by a bullish move.
- The Coinglass long-to-short ratio for SUI stands above one and rises, indicating more traders are betting for a rally.
- A daily candlestick close below $2.90 would invalidate the bullish thesis.
Sui (SUI) price action hints at a double-bottom technical formation, which tends to be followed by a bullish move. The Coinglass long-to-short ratio for SUI stands above one and rises, indicating more traders are betting for a rally in SUI.
Sui price is set for a rally if it closes above $3.65
Sui price action found support and bounced after retesting the $2.90 level in early February. It faced rejection around the $3.65 last week and found support around the $2.90 level again on Tuesday. This price action shows the formation of a W-like structure known as a double-bottom pattern that often signals a potential trend reversal favoring the bulls. At the time of writing on Thursday, SUI continues to trade at around $3.31.
If Sui breaks and decisively closes above $3.65, it would extend the raise to retest its technical target at $4.48.
The Relative Strength Index (RSI) on the daily chart reads 44, approaching its neural level of 50 and points upwards, indicating slight strength in momentum. For the bullish momentum to be sustained, the RSI must trade above its neutral level of 50.
The Moving Average Convergence Divergence (MACD) showed a bullish crossover in the daily chart last week, giving buy a signal and suggesting an upward trend.
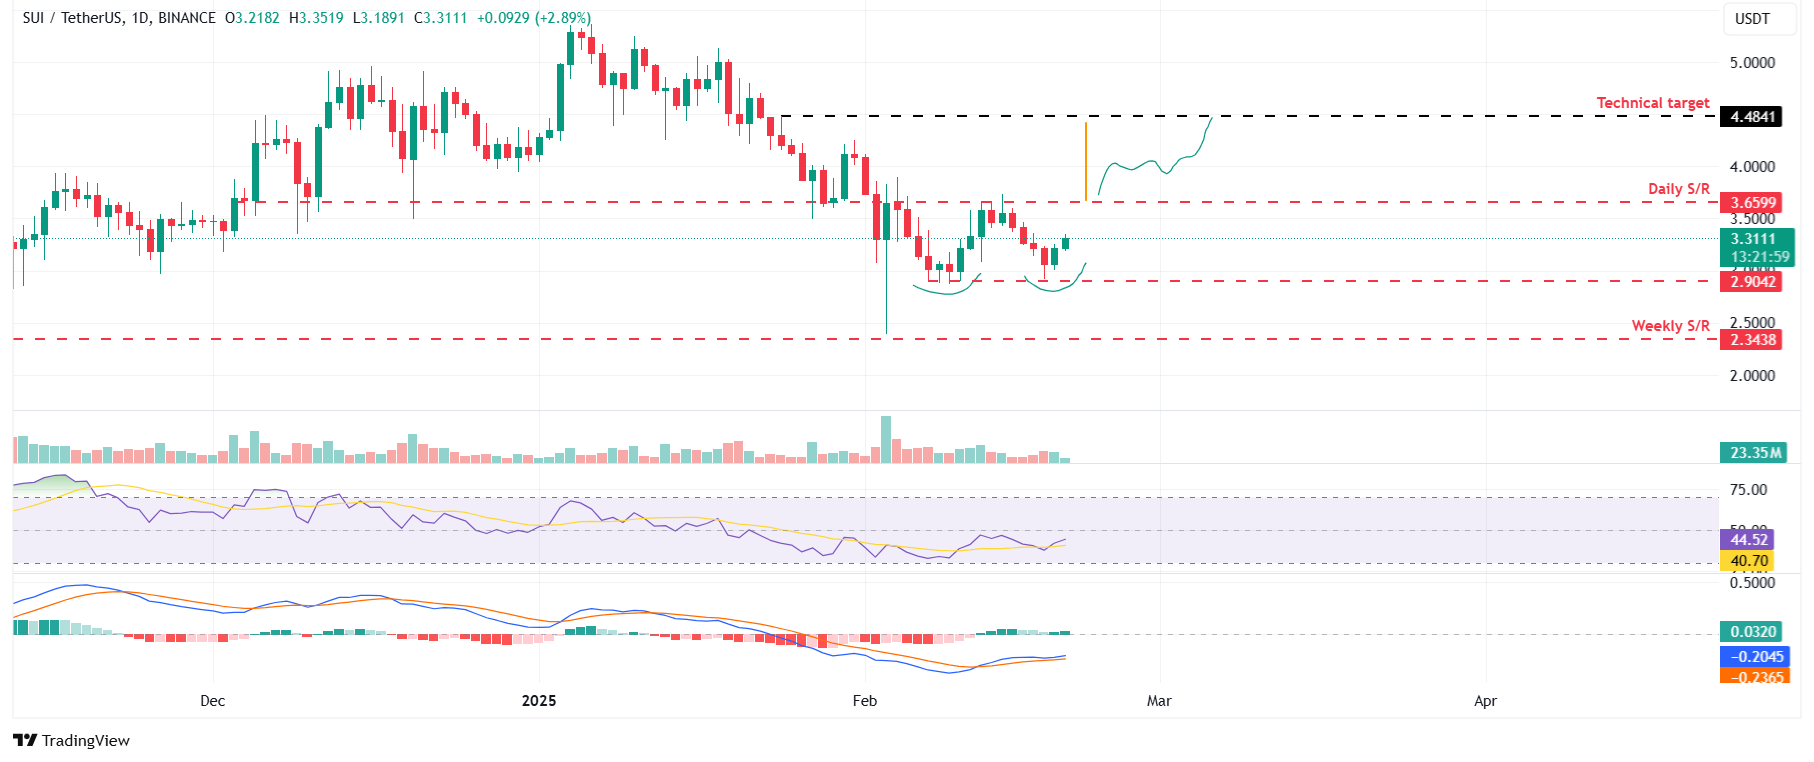
SUI/USDT daily chart
Another bullish sign is Coinglass’ SUI long-to-short ratio, which reads 1.01 and continues to rise. This ratio above one reflects bullish sentiment in the markets as more traders are betting on the asset price to rise.
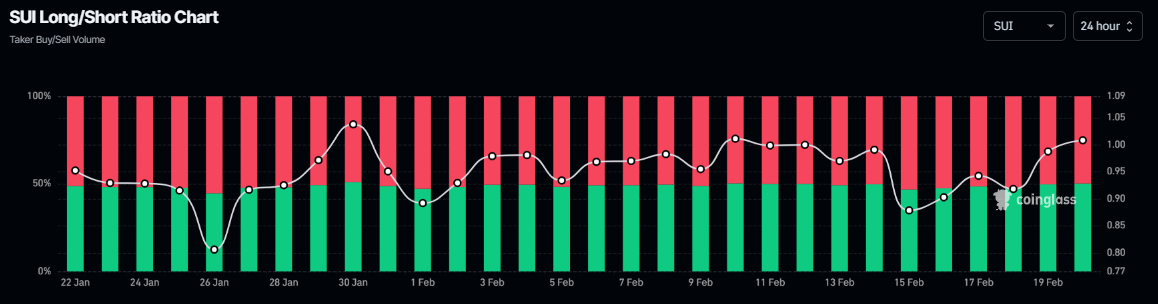
SUI long-to-short ratio chart. Source: Coinglass
However, if SUI closes below $2.90, the bullish thesis would be invalidated, leading to a price decline to retest its next weekly support at $2.34.