Bitcoin Weekly Forecast: BTC remains calm before a storm

- Bitcoin's price has been consolidating between $85,000 and $88,000 this week.
- A K33 report explains how the markets are relatively calm and shaping up for volatility as traders absorb the tariff announcements.
- PlanB’s S2F model shows that Bitcoin looks extremely undervalued compared to Gold and the housing market.
Bitcoin (BTC) price has been consolidating between $85,000 and $88,000 this week, approaching the lower boundary of the consolidation range when writing on Friday. A K33 Research report explains how the markets are relatively calm and shaping up for volatility as investors absorb the tariff announcements. PlanB’s Stock-to-Flow (S2F) model shows that Bitcoin looks extremely undervalued compared to Gold and the housing market.
Bitcoin price remains calm ahead of Trump’s tariff announcements
Bitcoin kicked off the week on a positive tone, reaching a high of $88,765 on Monday after recovering 4.25% the previous week. This rebound was driven by a Wall Street Journal report on Monday, suggesting that the White House was narrowing its approach to tariffs set to take effect on April 2, likely omitting a set of industry-specific tariffs while applying reciprocal levies on a targeted set of nations that account for the bulk of foreign trade with the US. The news sparked optimism in the crypto market that day, with major cryptocurrencies rising and Bitcoin surpassing the $88,000 mark.
Tuesday's K33 Research “Ahead of the Curve” report highlighted that the current market conditions are relatively calm and are shaping up for volatility as the market absorbs the tariff announcements. The report explains that the market’s calm tone may persist until April 2, the scheduled date for United States (US) President Donald Trump’s major reciprocal tariffs announcement. This is shaping into a major market event, likely to reignite activity across both crypto and broader financial markets, similar to the sharp moves seen after Canadian and Mexican tariff developments earlier this quarter.
If Trump softens his stance, markets could rally. If the President remains vague, volatility may hit both long and short positions. If he takes a hard line, a sharp decline — similar to past tariff-related drops — is likely, as shown in the graph below.
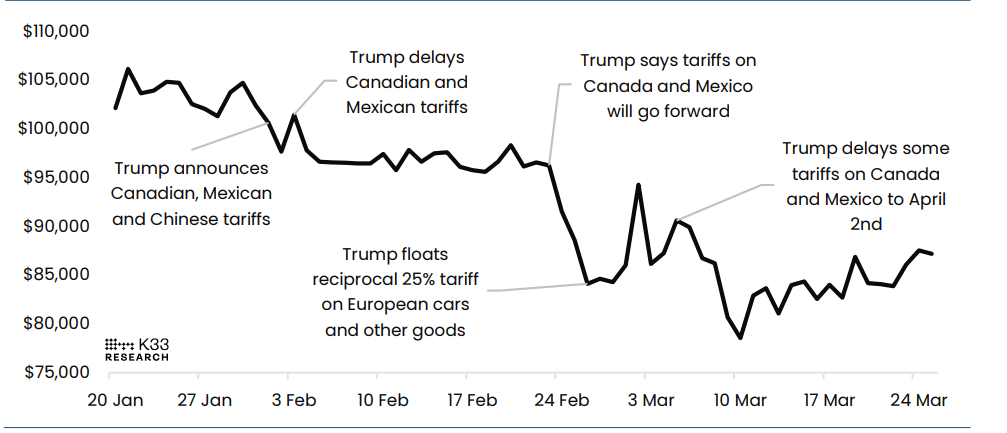
BTCUSD vs tariff headlines chart. Source: K33 Research
“In a back-and-forth scenario, we could see a market environment similar to February and early March, when tariffs dominated the narrative. The US economy remains strong but is widely expected to slow due to tariffs — a risk already largely priced in by most economists,” says K33’s analyst.
However, on Wednesday, President Trump announced a 25% tariff on automobile imports, effective April 3, alongside the long-anticipated reciprocal tariffs against the US’ largest trade partners. “Any further retaliation from these target economies risks injecting a fresh wave of uncertainty into an already volatile global trade landscape,” says QCP Capital’s analyst.
To gain more insight into how crypto markets would react to these tariff policies, FXStreet interviewed some experts in the crypto markets in this report.
Corporate companies' interest rises towards BTC with GameStop joining holders' group
Corporate companies’ interest in Bitcoin continues to rise. This week, GameStop (GME), a US video game retailer company, announced on Tuesday that it had updated its investment policy to include Bitcoin as a treasury reserve asset. The next day, in a press release, the company revealed its intention to issue $1.3 billion in senior convertible notes with a 0% interest rate through a private offering to investors.
GameStop follows in MicroStrategy’s footsteps, which acquired 6,911 BTC for $584.1 million earlier this week and currently holds 506,137 BTC acquired for $33.7 billion at an average price of $66,608 per Bitcoin, making it the largest corporate holder of the cryptocurrency.
The move aligns with a broader trend of corporate adoption of Bitcoin, spurred by US President Donald Trump’s recent executive order to establish a strategic cryptocurrency reserve using government-held tokens. GME has $4.7 billion in cash and cash equivalent as of February 1.
Bitcoin looks undervalued compared to Gold and the housing market
PlanB, the Stock-to-Flow (S2F) mode creator, posted that Bitcoin looks extremely undervalued compared to Gold and the housing market in his post on X.
It explains that Bitcoin's market capitalization is $2 trillion versus Gold’s $20 trillion. Bitcoin scarcity (S2F-ratio) is 120 versus Gold at 60 years, suggesting room for growth in this cycle.
The Glassnode' Forging Long-Term Holders' report highlights that the Bitcoin market is trading within a new range between $78,000 and $88,000. On-chain profit- and loss-taking events are declining in magnitude, highlighting a weaker demand profile and less sell-side pressure.
The report further explains that the short-term holders are experiencing fairly significant financial stress, with a large proportion of their holdings now underwater relative to the original cost basis, as shown in the graph below.
-638787560387691904.webp)
Bitcoin STH percentage supply in loss chart. Source: Glassnode
"Whilst the STH cohort are dominating losses taken, the Long-Term Holder cohort are transitioning back into a period of accumulation, and we expect their aggregate supply to grow in the coming weeks and months as a result," says Glassnode analyst.
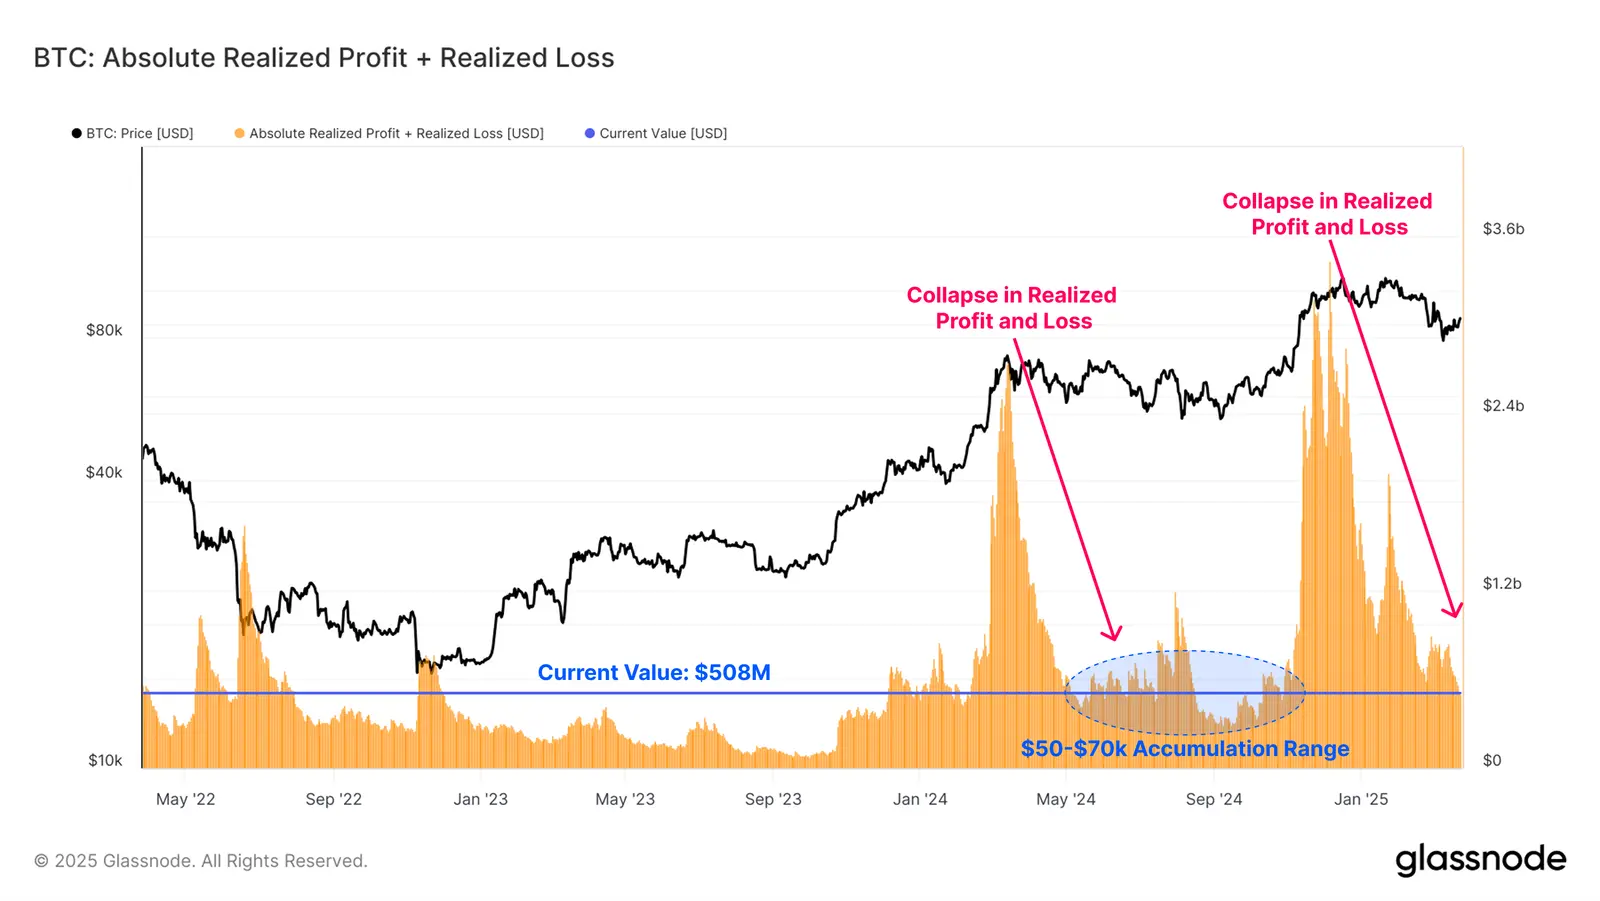
BTC: Absolute realized profit + realized loss chart. Source: Glassnode
Bitcoin's technical outlook shows a range-bound market
After breaking and closing above the 200-day Exponential Moving Average (EMA) on Sunday, Bitcoin’s price has been consolidating between $85,000 and $88,000 during the week. At the time of writing on Friday, BTC trades slightly down, approaching the lower boundary of the consolidation range.
If BTC breaks below the consolidation range, which roughly coincides with the 200-day EMA at $85,500, it could extend the decline to retest its next support level at $78,258.
The Relative Strength Index (RSI) indicator on the daily chart consolidates around the neutral level of 50, showing a lack of momentum.
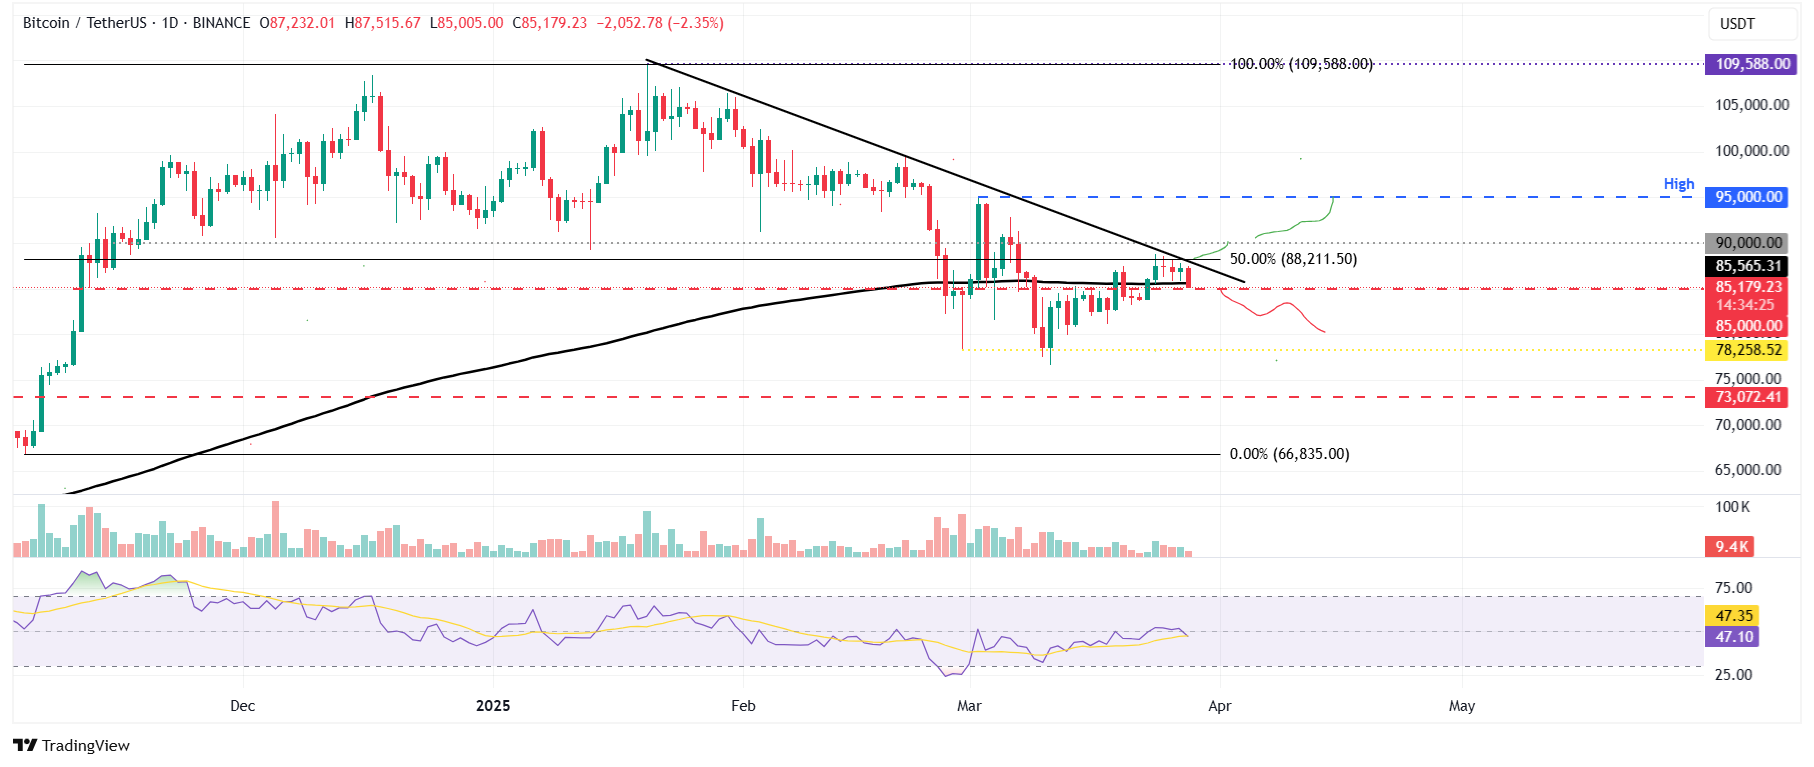
BTC/USDT daily chart
However, if the 200-day EMA holds as support and BTC breaks and closes above the descending trendline (drawn by connecting multiple high levels since mid-January), which roughly coincides with the top boundary of the recent range, it could extend the recovery to retest the key psychological level of $90,000 and the March 2 high of $95,000.
Bitcoin, altcoins, stablecoins FAQs
What is Bitcoin?
Bitcoin is the largest cryptocurrency by market capitalization, a virtual currency designed to serve as money. This form of payment cannot be controlled by any one person, group, or entity, which eliminates the need for third-party participation during financial transactions.
What are altcoins?
Altcoins are any cryptocurrency apart from Bitcoin, but some also regard Ethereum as a non-altcoin because it is from these two cryptocurrencies that forking happens. If this is true, then Litecoin is the first altcoin, forked from the Bitcoin protocol and, therefore, an “improved” version of it.
What are stablecoins?
Stablecoins are cryptocurrencies designed to have a stable price, with their value backed by a reserve of the asset it represents. To achieve this, the value of any one stablecoin is pegged to a commodity or financial instrument, such as the US Dollar (USD), with its supply regulated by an algorithm or demand. The main goal of stablecoins is to provide an on/off-ramp for investors willing to trade and invest in cryptocurrencies. Stablecoins also allow investors to store value since cryptocurrencies, in general, are subject to volatility.
What is Bitcoin Dominance?
Bitcoin dominance is the ratio of Bitcoin's market capitalization to the total market capitalization of all cryptocurrencies combined. It provides a clear picture of Bitcoin’s interest among investors. A high BTC dominance typically happens before and during a bull run, in which investors resort to investing in relatively stable and high market capitalization cryptocurrency like Bitcoin. A drop in BTC dominance usually means that investors are moving their capital and/or profits to altcoins in a quest for higher returns, which usually triggers an explosion of altcoin rallies.