Bitcoin Price Forecast: BTC volatility hits multi-month lows, raising concerns of liquidation cascades


- Bitcoin price has been consolidating between $94,000 and $100,000 for two weeks.
- FTX repayments on Tuesday dipped Bitcoin towards its lower boundary of the consolidating range.
- A K33 report highlights volumes, yields, options premiums, and ETF flows have moved to areas not seen since before the US Presidential election, with volatility at multi-month lows.
Bitcoin (BTC) price has been consolidating between $94,000 and $100,000 for two weeks. Defund exchange FTX repayments on Tuesday dipped Bitcoin towards its lower boundary of the consolidating range. A K33 report highlights volumes, yields, options premiums, and Exchange Traded Funds (ETF) flows have moved to areas not seen since before the US Presidential election in November, with volatility at multi-month lows and raising concerns of liquidation cascades.
FTX repayments dip Bitcoin prices
Bitcoin price dipped, reaching a low of $93,388 on Tuesday, but recovered to close above $95,600. This price knee-jerk move was mostly fueled by the news that FTX has begun repaying funds to customers with account balances of $50,000 or less. FTX also announced that repayments to customers over $50,000 will start on May 30.
According to Arkham data, the bankrupt exchange started repaying its creditors on Tuesday. Users with FTX claims of under $50,000 have started receiving funds through distribution providers Kraken and Bitgo. This wave of creditors represents approximately $1.2 billion in value. However, the payouts are expected to total up to $16.5 billion.
FTX USERS RECEIVING FUNDS
— Arkham (@arkham) February 18, 2025
Users with FTX claims of under $50,000 have started to receive funds today through distribution providers Kraken and Bitgo.
This wave of creditors represents approximately $1.2B in value. pic.twitter.com/SFGdsNOrBS
Bitcoin volatility reaches multi-month lows
Tuesday's K33 Research 'Ahead of the Curve' report highlights volumes, yields, options premiums, and ETF flows have moved to areas not seen since before the US Presidential election in November, with volatility at multi-month lows.
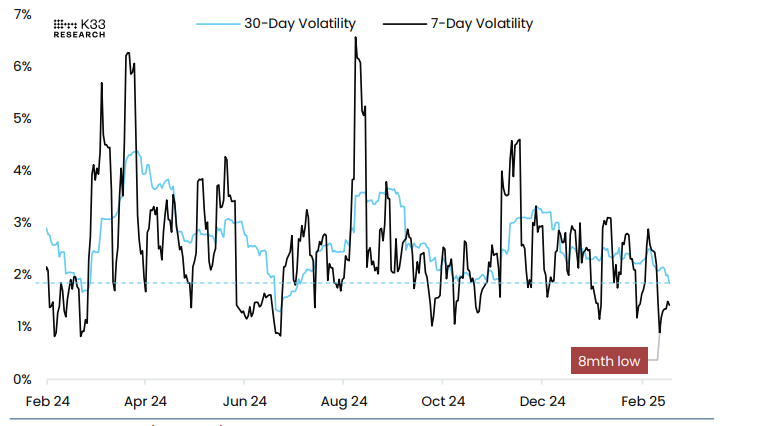
BTC/USD volatility chart. Source: K33 Research
The report further explains that as of February 13, 37% of the top 100 US companies exhibited greater 30-day volatility than BTC, a level not seen since October 2023. As evidenced in the graph below, such volatility regimes rarely last long, and traders should be ready for a sudden regime change.
An overall risk-averse sentiment suggests traders are prepared for downside volatility, while moderate leverage levels currently point toward less overhanging risks of liquidation cascades.
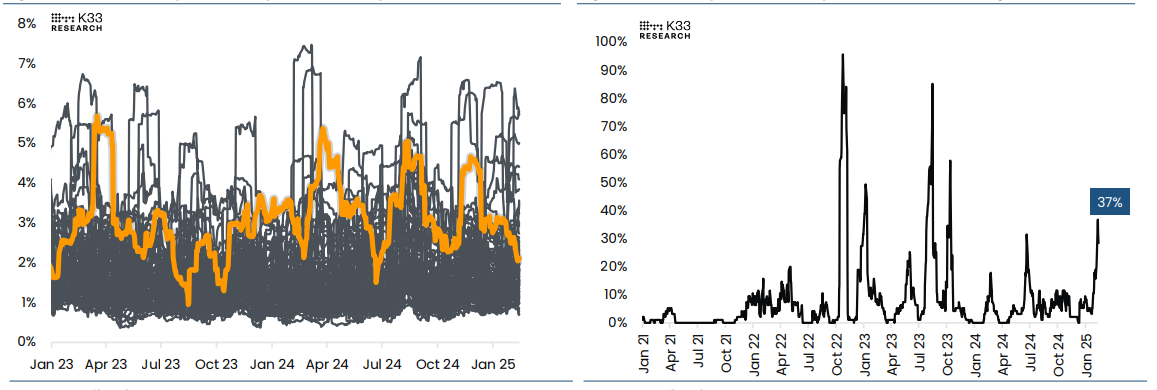
(Left) 30-day volatility: BTC vs top 100 US companies chart. (Right) % of top US companies with 30-day volatility higher than the BTC chart. Source: K33 Research report
"Extracting meaningful insights from the current market remains challenging, as Bitcoin remains rangebound with declining activity and yields." says a K33 analyst.
The analyst continued that no clear catalysts are in sight, and Chicago Mercantile Exchange (CME) premiums mirror the August-September 2024 lull, with moderate positioning prevailing.
Currently, the premiums have fallen below 5% — a level sustained for only 65 days since January 1, 2023. From 2023 to today, forward 30-day returns during such periods have outpaced returns in higher CME yield environments. However, from 2021 to 2025, low CME premiums have generally signaled weaker performance, largely influenced by the prolonged 2022 bear market.
This reinforces a key tendency — Bitcoin performs best in a stronger basis regime. Given the current uncertainty, "we advise caution until a clear directional signal emerges."
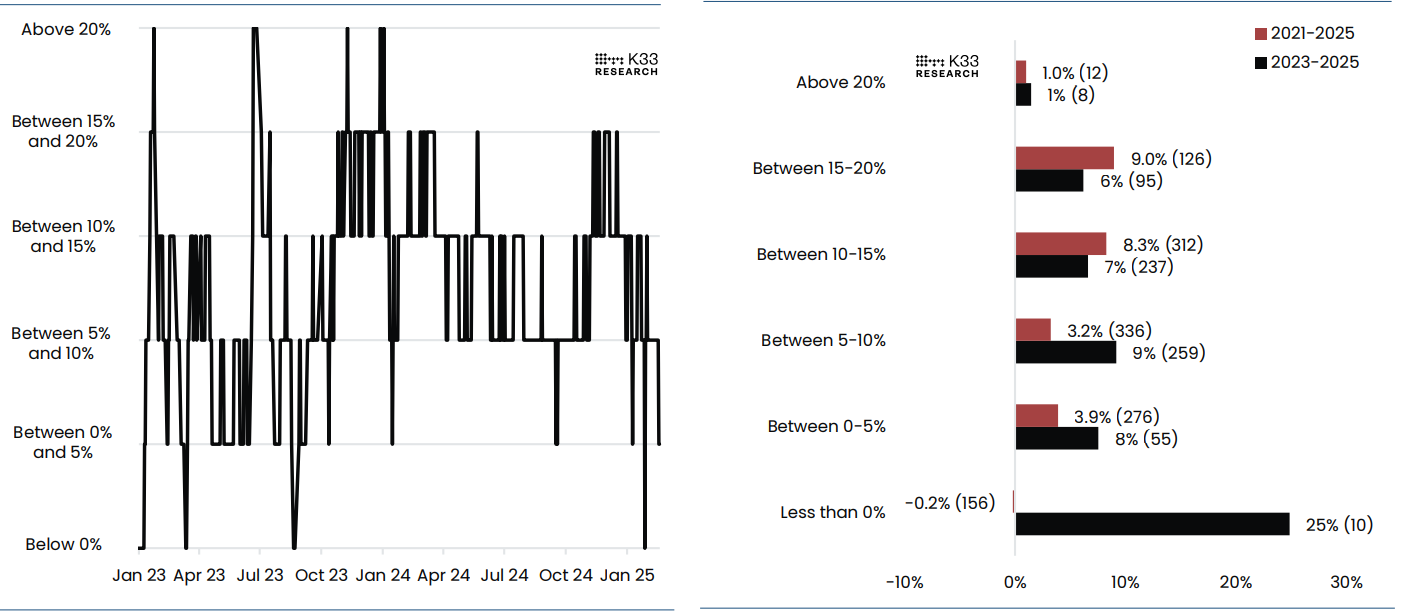
(Left) CME Bitcoin Futures: Basis regimes chart. (Right) BTCUSDT Forward Return, CME Basis chart. Source: K33 Research
Bitcoin Price Forecast: Indecisiveness among traders
Bitcoin price broke below the $100,000 support level on February 4 and has been consolidating between $94,000 and $100,000 since then. On Tuesday, BTC declined and found support around its lower boundary of the consolidating range. At the time of writing on Wednesday, it hovers around $96,300.
If BTC breaks and closes below the lower boundary of the consolidating range of $94,000, it could extend the decline to test its psychologically important level of $90,000.
The Relative Strength Index (RSI) on the daily chart reads 42, consolidating after being rejected at its neutral level of 50 last week and indicating slightly bearish momentum.
The Moving Average Convergence Divergence (MACD) coils around each other, indicating indecisiveness among traders as consolidation in BTC’s price continues.
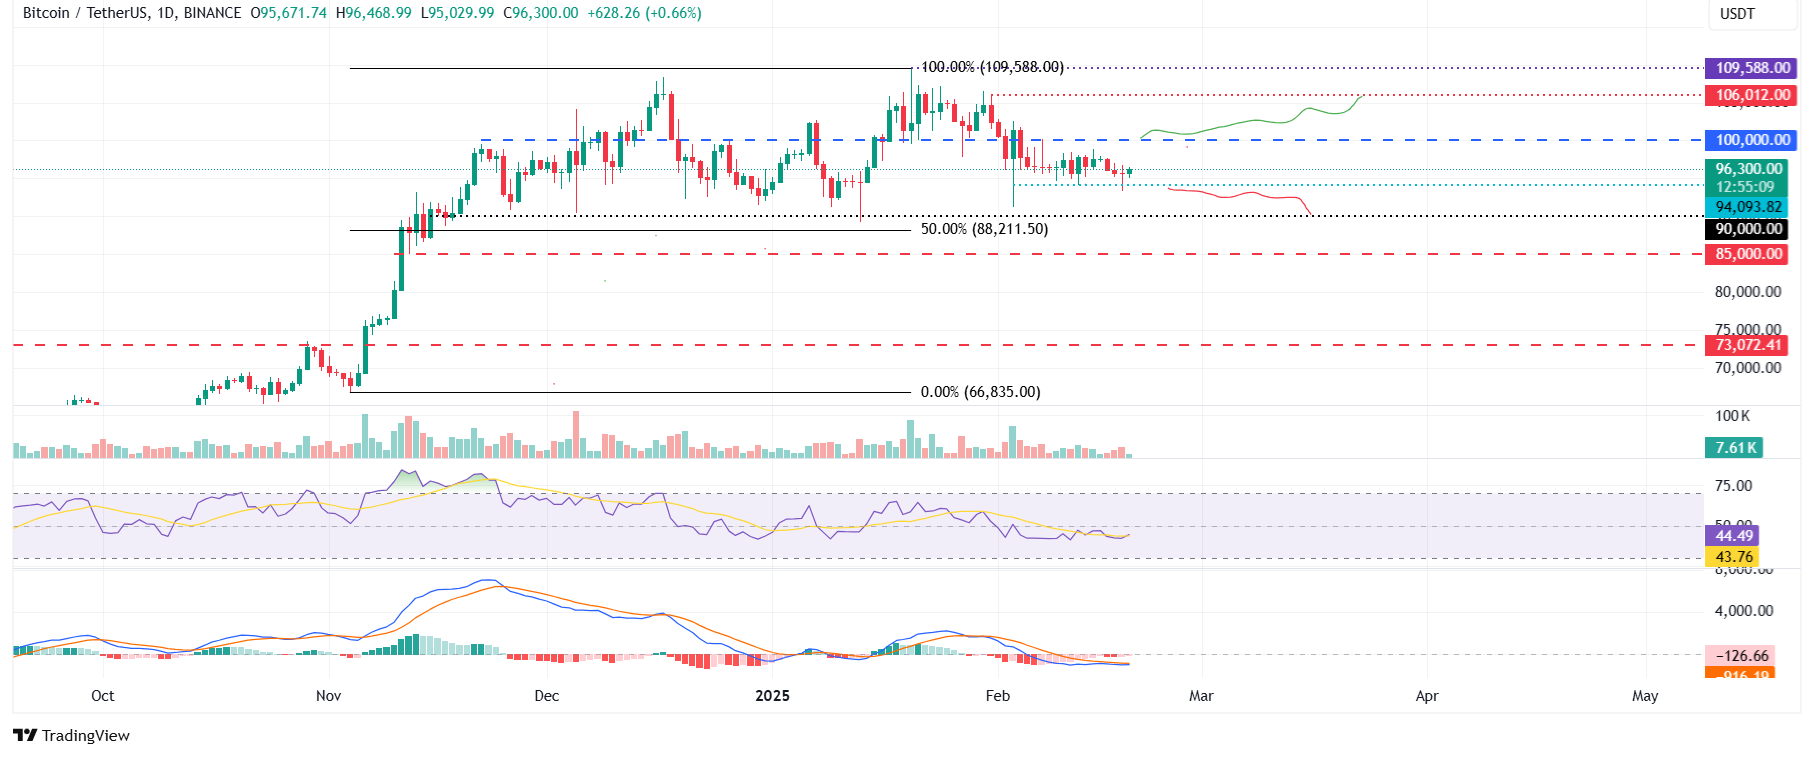
BTC/USDT daily chart
However, if BTC recovers and breaks above the upper boundary of the consolidating range of $100,000, it would extend the recovery to retest its January 31 high of $106,012.
Bitcoin, altcoins, stablecoins FAQs
What is Bitcoin?
Bitcoin is the largest cryptocurrency by market capitalization, a virtual currency designed to serve as money. This form of payment cannot be controlled by any one person, group, or entity, which eliminates the need for third-party participation during financial transactions.
What are altcoins?
Altcoins are any cryptocurrency apart from Bitcoin, but some also regard Ethereum as a non-altcoin because it is from these two cryptocurrencies that forking happens. If this is true, then Litecoin is the first altcoin, forked from the Bitcoin protocol and, therefore, an “improved” version of it.
What are stablecoins?
Stablecoins are cryptocurrencies designed to have a stable price, with their value backed by a reserve of the asset it represents. To achieve this, the value of any one stablecoin is pegged to a commodity or financial instrument, such as the US Dollar (USD), with its supply regulated by an algorithm or demand. The main goal of stablecoins is to provide an on/off-ramp for investors willing to trade and invest in cryptocurrencies. Stablecoins also allow investors to store value since cryptocurrencies, in general, are subject to volatility.
What is Bitcoin Dominance?
Bitcoin dominance is the ratio of Bitcoin's market capitalization to the total market capitalization of all cryptocurrencies combined. It provides a clear picture of Bitcoin’s interest among investors. A high BTC dominance typically happens before and during a bull run, in which investors resort to investing in relatively stable and high market capitalization cryptocurrency like Bitcoin. A drop in BTC dominance usually means that investors are moving their capital and/or profits to altcoins in a quest for higher returns, which usually triggers an explosion of altcoin rallies.