Bitcoin Extreme Greed Is Nearly Here: Will This Lead To A Top?

Data shows the Bitcoin market sentiment has nearly turned to extreme greed as the cryptocurrency’s price has rallied to the $68,000 mark.
Bitcoin Fear & Greed Index Is Currently Inside The Greed Region
The “Fear & Greed Index” is an indicator created by Alternative that tells us about the average sentiment present among traders in the Bitcoin and wider cryptocurrency markets. This index makes use of the data of the following five factors in order to determine the sentiment: trading volume, volatility, social media sentiment, market cap dominance, and Google Trends. Once found, it represents the market mentality as a score between 0 and 100.
When the metric has a value greater than 53, it means the traders as a whole share a sentiment of greed right now. On the other hand, it being under the 47 mark implies the dominance of fear in the market. The territory in-between these two corresponds to a net neutral mentality.
Besides these three main sentiment zones, there are also two special regions called the extreme fear and the extreme greed. The former of these occurs at 25 and under, while the latter at 75 and above.
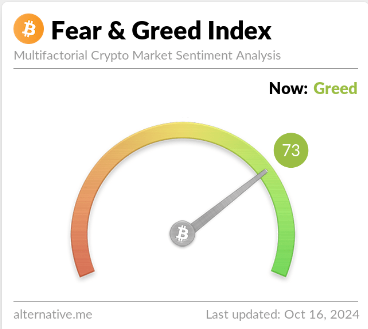
Now, here is what the latest value of the Bitcoin Fear & Greed Index has been like:

As is visible above, the indicator has a value of 73, which suggests that the investors are currently showing a significant amount of greed. This is a notable change from how the mood in the market was last week, as the index had declined into the fear zone then.
The below chart shows how the value of the Bitcoin Fear & Greed Index has changed over the past year:

From the graph, it’s visible that this latest uplift in the sentiment, which has come as a result of the asset’s rally to $68,000, has taken the index to the highest value since the end of July. Back then, the high sentiment values had led to a top for the cryptocurrency. This type of pattern is something that has actually been witnessed throughout history.
It turns out that Bitcoin has a tendency to move in the direction opposite to what the crowd is expecting and the probability of such a contrary move increases the more the traders lean towards one side.
In the extreme regions, this likelihood is the strongest, so tops and bottoms have often formed when the investors have shared these sentiments. The current value of the index is just outside the extreme greed zone, so a top could become likely for the asset should the investor mentality continue to improve.
The sentiment may also not even have to improve further for such a scenario to follow out, as the top back in July had occurred when the index had a value of 74, only one unit greater than the current one.
BTC Price
At the time of writing, Bitcoin is trading at around $68,000, up more than 9% over the last week.


