BNB Under Siege: Failed Recovery Sparks Fears of Deeper Losses


BNB finds itself under renewed selling pressure as a recent recovery attempt falls short, leaving the cryptocurrency vulnerable to further losses. Despite a brief upward movement, BNB’s failure to break through key resistance levels has sparked concerns about a deepening decline. With technical indicators signaling potential weakness ahead, the question now is whether the token can regain its footing or if further losses are inevitable.
As bearish sentiment intensifies, this analysis aims to evaluate the technical indicators signaling weakness in BNB’s price action and assess whether the asset can stage a recovery or face more declines. By exploring key support levels, market sentiment, and price trends, the goal is to determine BNB’s next move and the likelihood of a bullish reversal or sustained bearish momentum.
Key Technical Indicators Flash Warning Signs
BNB has recently entered pessimistic territory on the 4-hour chart, dipping just below the 100-day Simple Moving Average (SMA) and approaching the crucial $531 support level. This drop below the 100-day SMA indicates weakening strength, and with sellers taking control, the cryptocurrency faces the potential for more losses.
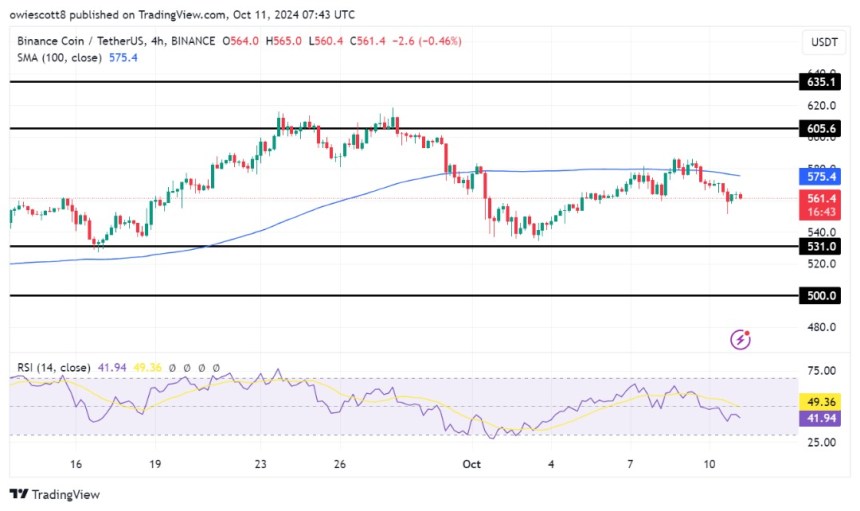
An analysis of the 4-hour Relative Strength Index (RSI) shows that the signal line has dropped below the 50% threshold toward 42%, suggesting that buying pressure is waning, as the RSI moves deeper into bearish territory. Typically, an RSI reading below 50% implies that sellers are gaining control, which could lead to downward pressure on the price.
After facing resistance at $587, BNB has shown significant downbeat movement on the daily chart, marked by the formation of a strong bearish candlestick. The price has now fallen toward the 100-day SMA, signaling mounting selling pressure. If the negative trend continues, BNB may experience additional declines, leading to a reduction in buying interest.
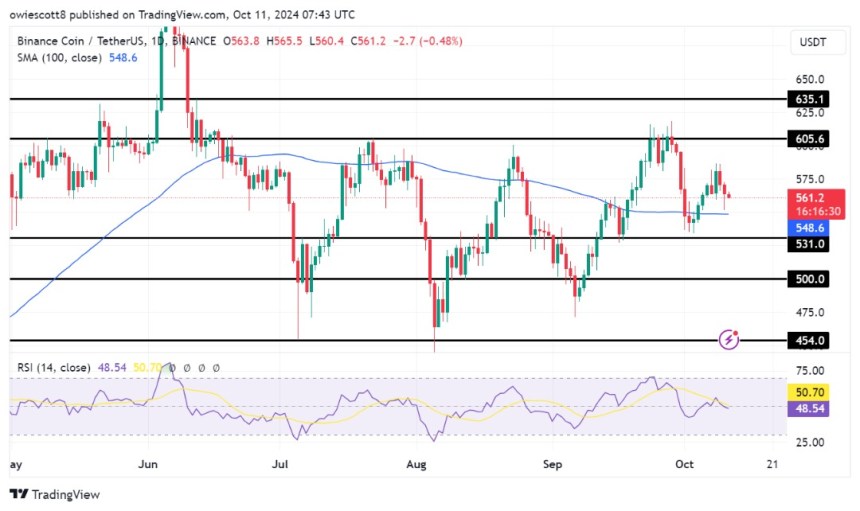
Furthermore, a closer look at the RSI on the 1-day chart shows that the signal line has once again dropped below the 50% threshold, now sitting at 48%, after previously rising above it. Unless the bulls step in to shift momentum, the market could be set for more drops, as the current RSI level suggests weakening buying strength and heightened bearish control.
Trading Strategy: Navigating BNB Bearish Pressure
BNB’s recent price action indicates potential continued declines if downbeat momentum intensifies. If the price hits the critical $531 mark and closes below it, this could pave the way for further losses, possibly driving the asset down toward the $500 level.
However, should buyers step in and regain control at the $531 level, there is a chance for a bullish reversal and the price will start moving upward toward the 605 resistance level, especially if the RSI shows signs of recovery.