BNB Falters At $600, Paving The Way For A Deeper Pullback

BNB bullish rally has hit a wall as the $600 resistance level proves to be a formidable barrier. After an impressive upward run, momentum has stalled, and downside pressure is starting to build. While bulls are struggling to regain control, the bears are gaining confidence, signaling a potential shift in market direction. With the rally halted and key support levels under threat, BNB is now facing an increased risk of a pullback, leaving traders on edge as the price hovers at this crucial threshold.
As BNB faces the formidable $600 resistance, the aim is to analyze the mounting pressure that has halted its recent rally. We will explore the technical indicators that signal a potential downturn, market sentiment, and potential price movements as the bulls fight to regain control.
Risk Assessment: Evaluating The Downside Potential
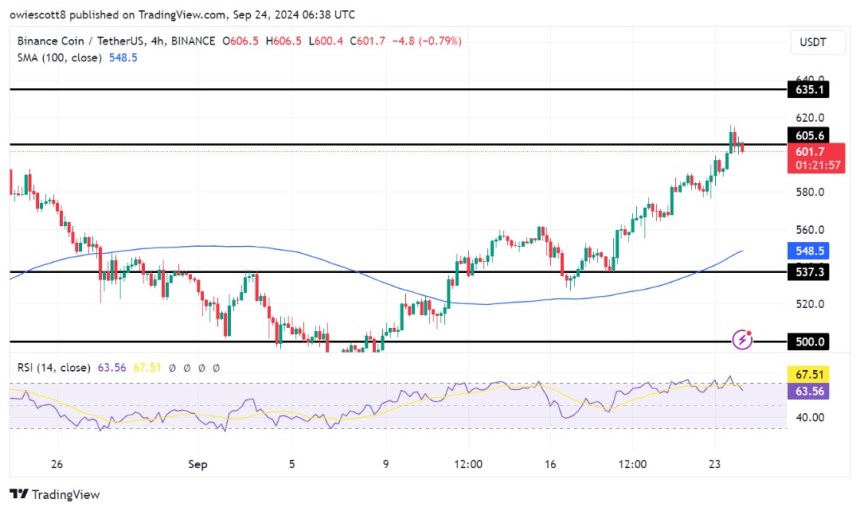
Despite BNB’s price trading above the 100-day Simple Moving Average (SMA) on the 4-hour chart, which typically signals a positive trend, the cryptocurrency has faced significant resistance at the $600 mark. This resistance has resulted in a noticeable pullback, indicating that upward momentum falters as sellers capitalize on the current price level.

An analysis of the 4-hour Relative Strength Index (RSI) suggests a potential price drop as the RSI line is dropping from the overbought zone toward the 50% threshold, reflecting rising bearish pressure for the cryptocurrency that might push the price toward $537.
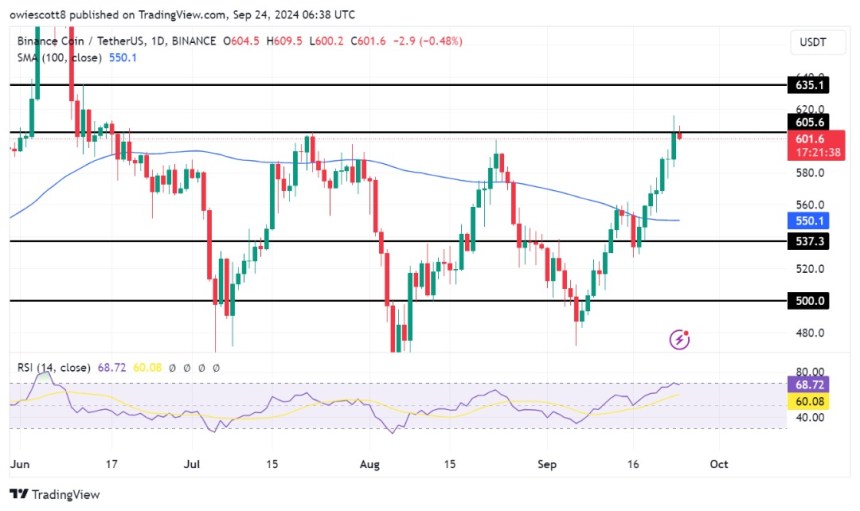
Also, on the daily chart, BNB is currently showing bearish momentum as it drops toward the $537 mark. Since breaking above the 100-day SMA, the price has experienced a consistent upward trend without any significant pullbacks, indicating that a huge correction may be on the horizon.

Finally, on the 1-day chart, a comprehensive analysis of the RSI signal line reveals a recent decline to 68% after peaking at 72%. This movement suggests a shift in momentum, signaling that BNB is entering a consolidation phase or facing increased selling pressure, which could lead to additional price corrections.
Future Outlook: What Lies Ahead for BNB?
Although the cryptocurrency has demonstrated resilience by maintaining its position above key moving averages, the increasing bearish pressure and recent pullbacks indicate that BNB’s price could decline toward the $537 support level. If it reaches this point and manages to break below, this could trigger a further drop toward other support levels, heightening concerns among traders about the potential for extended downward momentum.
Alternatively, if the bulls can stage a recovery before BNB reaches the $537 support level, the price could begin to rise again toward the $600 resistance. A breakout above this key level may open the door for more gains, with BNB likely testing higher resistance points as bullish momentum builds.


