Crude Oil climbs again, WTI marches toward $82 after EIA barrel count declines


- WTI edged into fresh highs near $81.40 as energy markets hope for drawdown.
- EIA barrel counts reported a larger-than-expected decline in US Crude Oil stocks.
- Barrel traders edge bids higher on extended hopes of a summertime supply crunch.
West Texas Intermediate (WTI) US Crude Oil inched into fresh highs on Thursday, clipping $81.40 and continuing its march towards the $82.00 handle. Crude Oil markets lurch forward on renewed hopes of a summertime upswing in fuel demand helping to chew away at a looming oversupply issue in global oil supplies.
The Energy Information Administration (EIA) reported an unexpected decline in US Crude Oil Stocks Change for the week ended June 14. EIA barrels counts printed a -2.547 million barrel decline, sharply down from the previous week’s 3.73 million barrel buildup and even lower than the forecast -2.0 million decline. Despite the drag on EIA barrel stocks, traders with a calculator handy will note that the week’s backslide brings EIA Crude Oil counts for the year to a 26 million barrel surplus.
Crude Oil markets are bidding up barrel prices as energy markets pin their hopes on a summertime uptick in fuel demand for cooling and travel purposes. This comes after an uptick in Chinese fossil fuel demand failed to materialize and a non-starter kickoff to the US Memorial Day “driving season.”
The Organization of the Petroleum Exporting Countries (OPEC) is set to phase out voluntary production cuts for its extended network of non-member ally states, OPEC+, later this year. OPEC+ nations that shouldered a significant burden in trying to bolster global Crude Oil prices by intentionally restricting the amount of unrefined Crude Oil they pull out of the ground has begun to weigh on government budgets that routinely rely on barrel-selling activity to balance accounts.
WTI technical outlook
WTI extended bullish momentum on Thursday, edging towards $81.50 as intraday bids accelerate above rising trendlines from the last major swing low into $72.50. US Crude Oil has climbed further above the 200-day Exponential Moving Average (EMA) at $78.85.
WTI has closed bullish for all but four of the last 12 consecutive trading days, climbing 12.34% from the last major low.
WTI hourly chart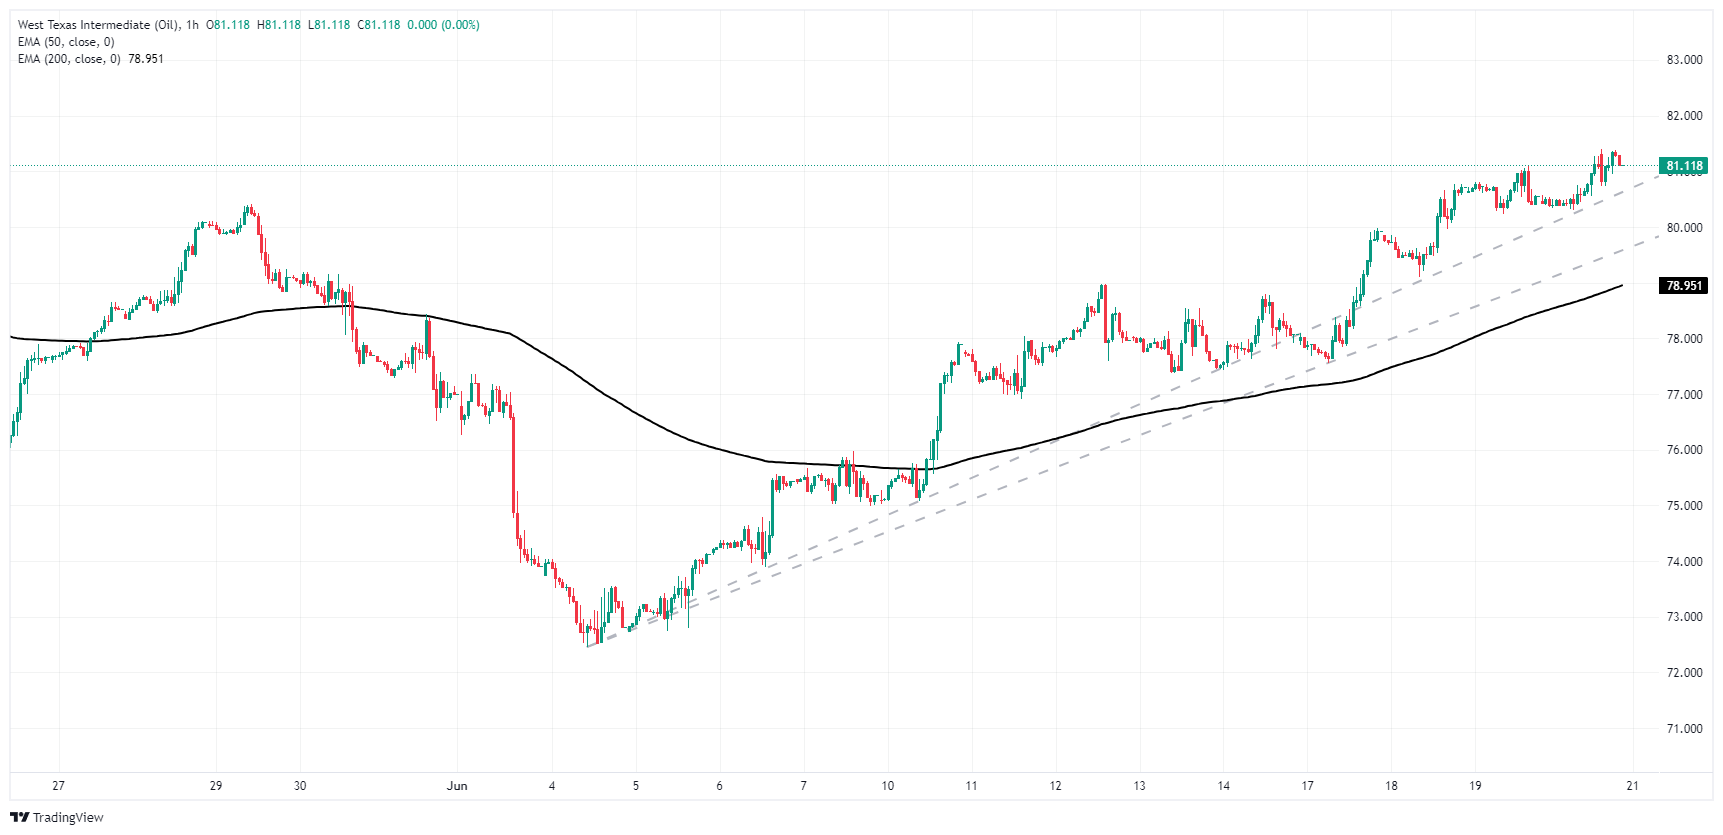
WTI daily chart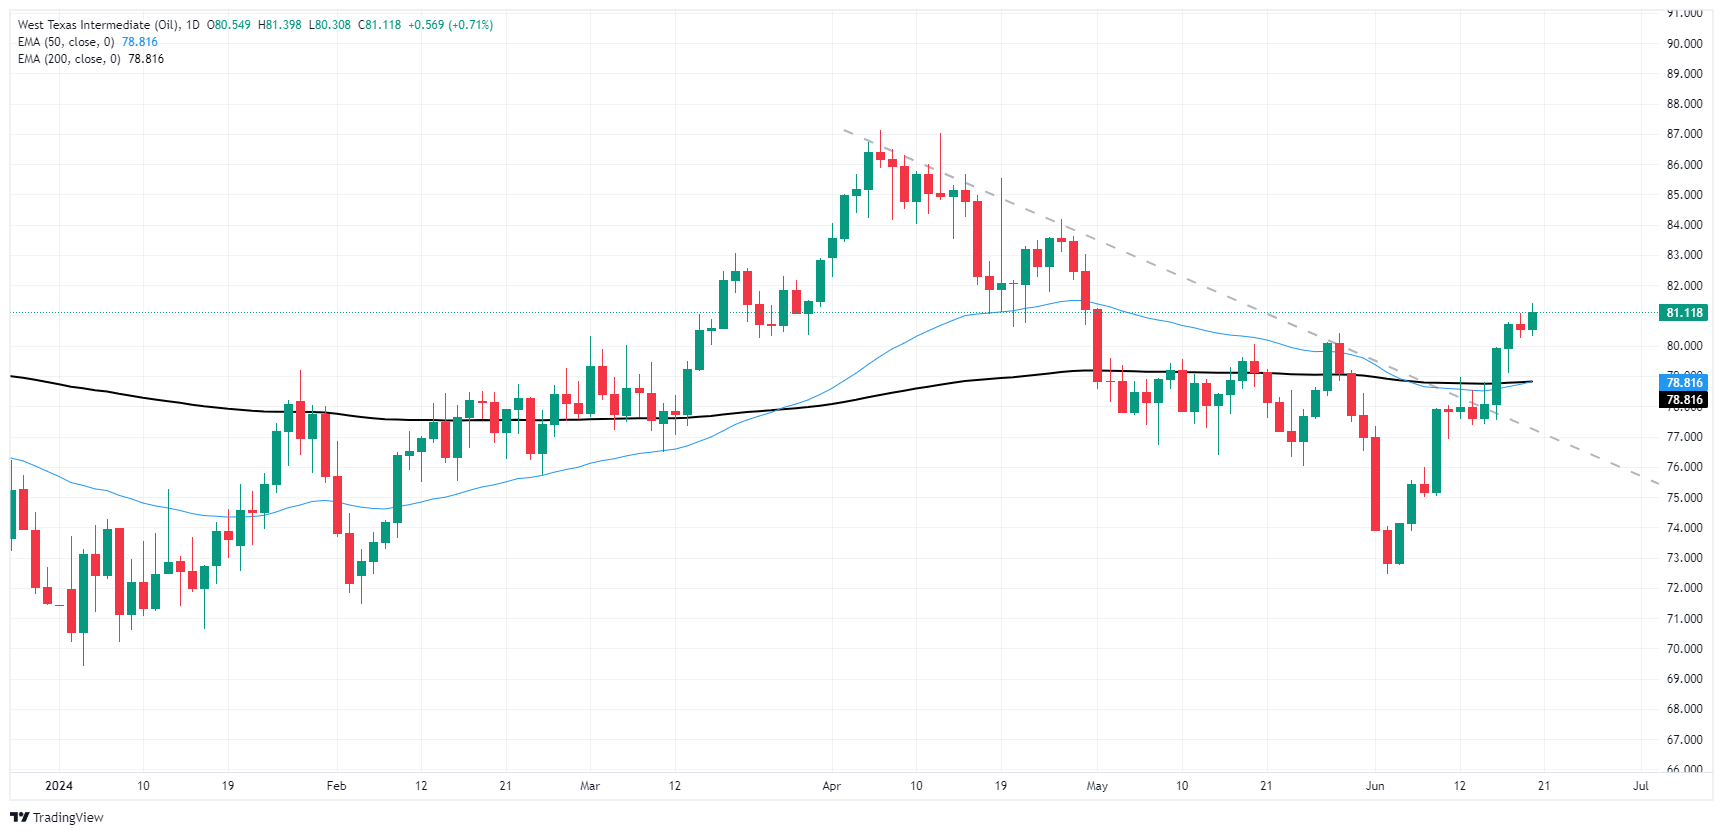
WTI US OIL
Overview | |
|---|---|
Today last price | 81.12 |
Today Daily Change | 0.57 |
Today Daily Change % | 0.71 |
Today daily open | 80.55 |
Trends | |
|---|---|
Daily SMA20 | 77.45 |
Daily SMA50 | 79.4 |
Daily SMA100 | 79.35 |
Daily SMA200 | 79.08 |
Levels | |
|---|---|
Previous Daily High | 81.09 |
Previous Daily Low | 80.24 |
Previous Weekly High | 78.98 |
Previous Weekly Low | 75.03 |
Previous Monthly High | 81.25 |
Previous Monthly Low | 76.04 |
Daily Fibonacci 38.2% | 80.57 |
Daily Fibonacci 61.8% | 80.76 |
Daily Pivot Point S1 | 80.16 |
Daily Pivot Point S2 | 79.78 |
Daily Pivot Point S3 | 79.32 |
Daily Pivot Point R1 | 81.01 |
Daily Pivot Point R2 | 81.47 |
Daily Pivot Point R3 | 81.86 |