Gold edges lower as traders fold arms ahead of labor market data


- Gold trades just below $2,500 as risk recedes, markets are calm, and the US Dollar recovers marginally.
- Traders await US labor market data this week before determining their next moves.
- The $2,500 level is key from a technical perspective, and it is threatening to give way under bearish pressure.
Gold (XAU/USD) edges lower into the $2,490s on Tuesday as a measure of market calm descends, which does little to drive up demand for safe-haven Gold.
The US Dollar (USD) – to which Gold is negatively correlated – slows in its recovery rally, trading only marginally higher on Tuesday as traders keep their powder dry ahead of the release of potentially market-moving US labor market data later this week.
Investors appear to be calmly awaiting the final “test results” for the patient – in this case the US economy – before drawing any conclusions about the likely course of action ahead, in terms of the Federal Reserve’s (Fed) decision on how much to cut interest rates – a key driver of Gold.
Demonstrations in Tel Aviv, demanding a ceasefire in Gaza after seven Israeli hostages were found dead, and the calling of a general strike by Israeli workers have, if anything temporarily, dialed down the threat level in at least one key geopolitical hotspot, adding to the uneasy calm permeating markets.
Gold traders look ahead to US employment data
Gold price is most likely to see volatility from the release of US labor market data this week. At his pivotal speech in Jackson Hole, Fed Chairman Jerome Powell turned the spotlight away from inflation and onto the fragile-looking labor market, suggesting that downside risks to employment were now greater than upside risks to inflation.
If labor market data out this week in the form of the ISM Manufacturing Employment Index on Tuesday, JOLTS Job Openings on Wednesday, ADP Employment Change, Jobless Claims and ISM Services Employment Index on Thursday, and Nonfarm Payrolls (NFP) on Friday, come out weaker than expected and back up his concerns, it will probably lead to a tumble in the US Dollar (USD) but a rise in the price of Gold.
Markets are debating whether the Fed will need to make a 50 basis point (bps) cut to interest rates in September or just a standard 25 bps cut. The latter is fully expected whilst market-based probabilities for the former sit currently at around 30%, according to the CME FedWatch Tool.
If labor market data is decidedly under par, the chances of a bigger cut will increase, which in turn will give Gold a leg up on the charts. Lower interest rates are positive for the precious metal because they make it comparably more attractive to investors as a non-interest-paying asset.
Technical Analysis: Tests base of mini-range
Gold (XAU/USD) is testing the base of the mini-range it has been trading in since late August, between $2,500 and $2,531. It is currently eroding the range floor, positing marginally lower lows as it descends. There is a risk it could break lower and enter a new zone of activity between the sloping top of the old range highs at about $2,470 and $2,500.
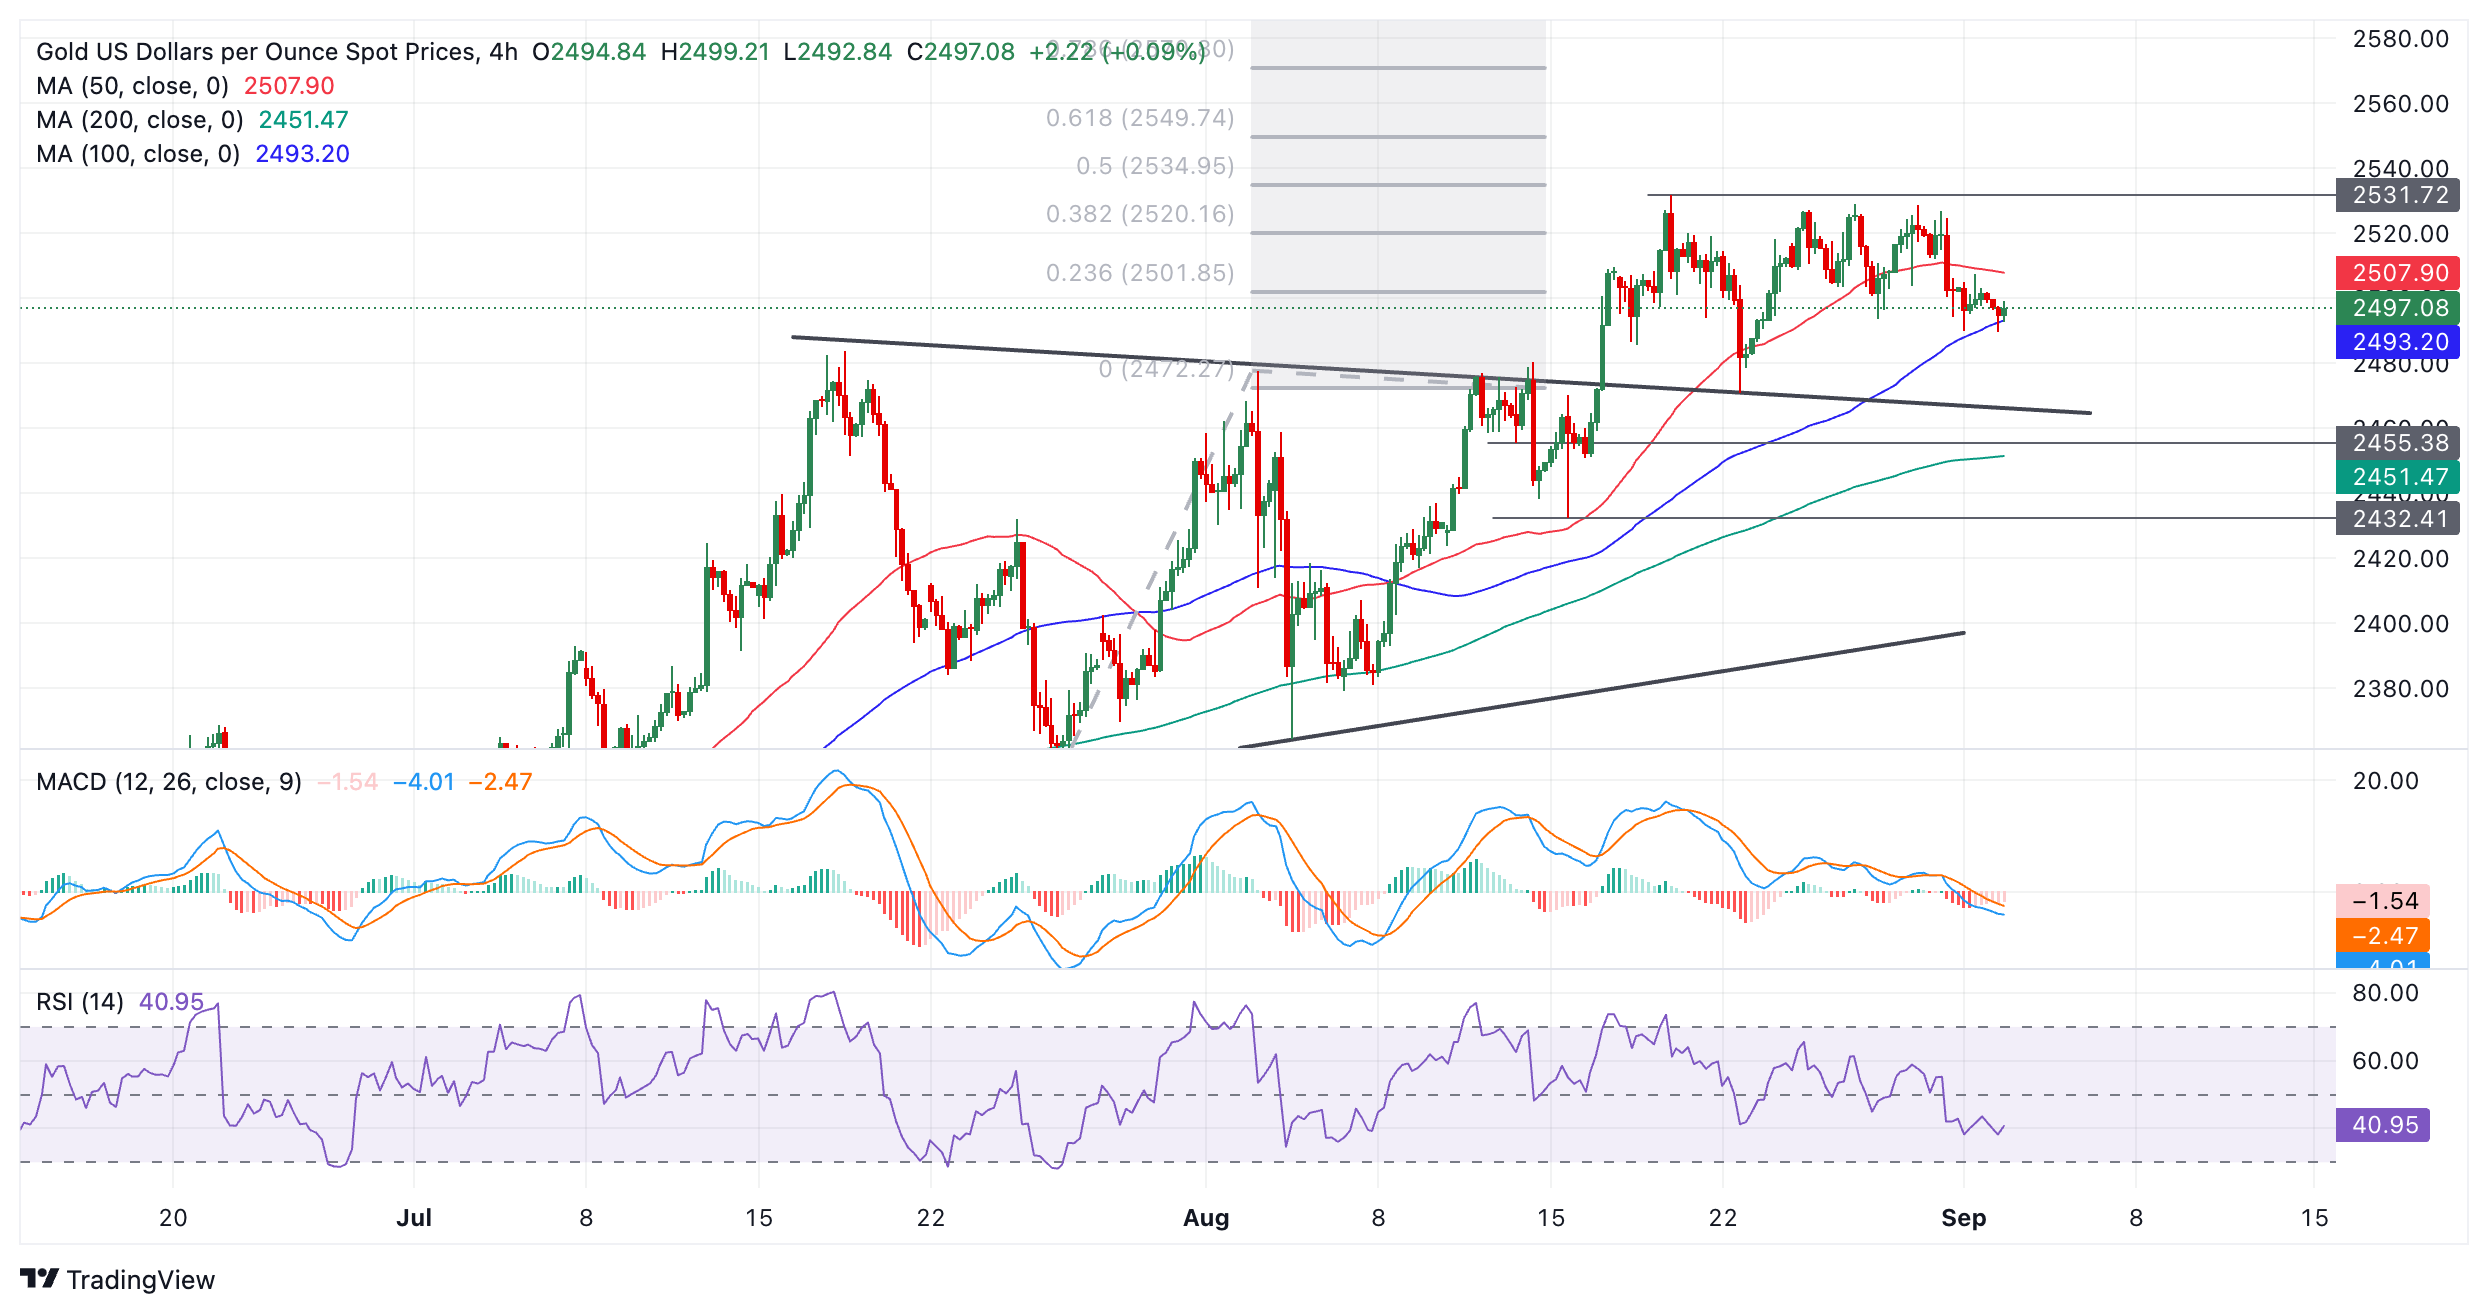
XAU/USD 4-hour Chart
That said, the ultimate as yet un-met upside target for Gold sits at $2,550 and remains active. This was generated after the original breakout from the prior range that started in July, which also looks like a triangle pattern because of its sloping edges.
This upside target was calculated by taking the 0.618 Fibonacci ratio of the range or triangle’s height and extrapolating it higher. This target is the minimum expectation for the follow-through from a breakout based on principles of technical analysis.
Gold’s medium and long-term trends remain bullish, which, given “the trend is your friend,” means the odds favor an eventual breakout higher materializing.
Yet it would require a break above the August 20 all-time high of $2,531 to provide more confirmation of a continuation higher toward the $2,550 target.
Alternatively, a break back inside the previous range would negate the projected upside target. Such a move would be confirmed on a daily close below $2,470 (August 22 low). It would change the picture for Gold and suggest that the commodity might start a short-term downtrend.
Economic Indicator
ISM Manufacturing Employment Index
The Institute for Supply Management (ISM) Manufacturing Index shows business conditions in the US manufacturing sector, taking into account expectations for future production, new orders, inventories, employment and deliveries. It is a significant indicator of the overall economic condition in US. The ISM Manufacturing Employment Index represents business sentiment regarding labor market conditions and is considered a strong Non-Farm Payrolls leading indicator. A high reading is seen as positive for the USD, while a low reading is seen as negative.
Read more.
Next release: Tue Sep 03, 2024 14:00
Frequency: Monthly
Consensus: -
Previous: 43.4
Source: Institute for Supply Management