Silver Price Forecast: XAG/USD depreciates to near $28.50 due to bearish bias

- Silver price faces challenges as daily chart analysis suggests a bearish bias.
- The MACD line has crossed below the signal line, indicating potential downward pressure on the Silver price.
- Silver price may navigate the area around the lower boundary of the descending channel at the level of $27.70 level.
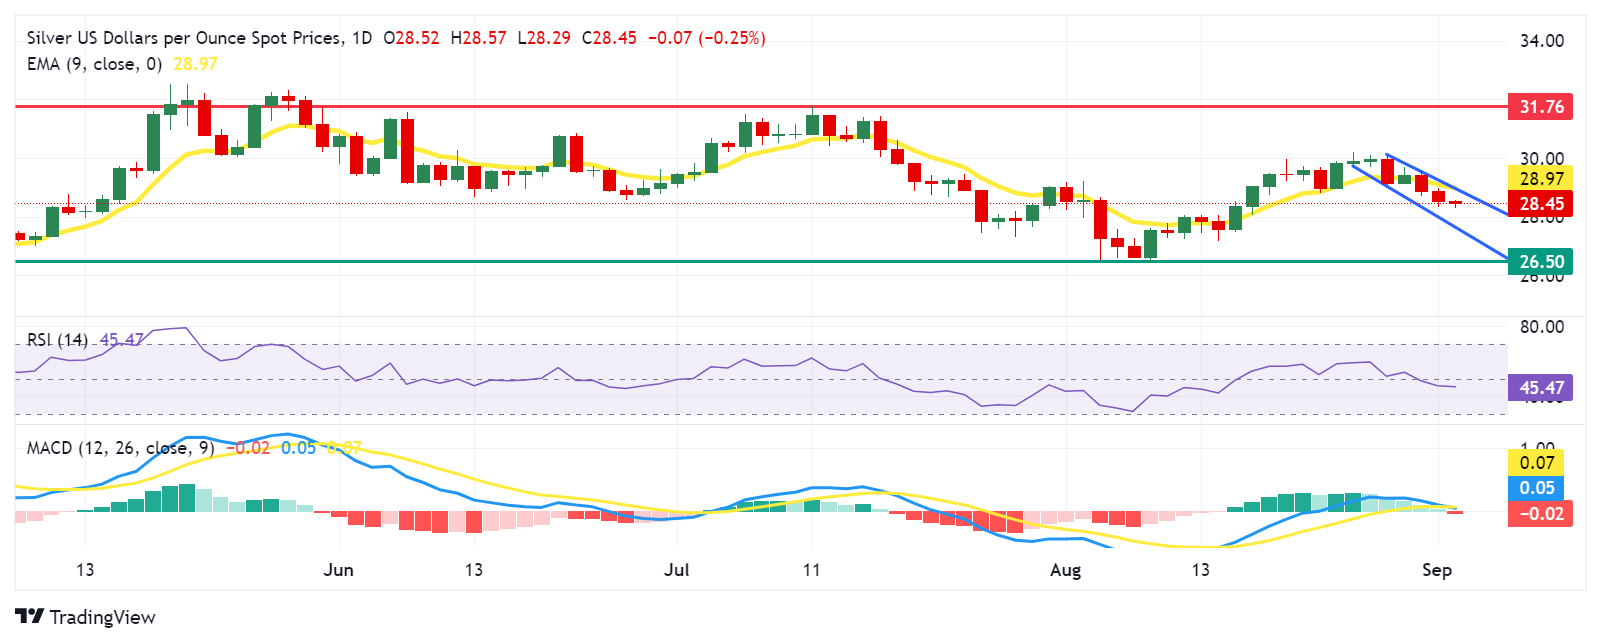
Silver price (XAG/USD) extends its losses for the third consecutive day, trading around $28.50 per troy ounce during Tuesday’s Asian hours. The analysis of the daily chart shows that the pair is positioned within a descending channel, suggesting a bearish bias. Additionally, the 14-day Relative Strength Index (RSI) is positioned below the 50 level, confirming a bearish trend.
The momentum indicator Moving Average Convergence Divergence (MACD) line has crossed below the signal line, it is generally considered a bearish signal. This crossover suggests that the momentum is shifting from bullish to bearish, indicating potential downward pressure on the Silver's price.
In terms of support, the Silver price may navigate the region around the lower boundary of the descending channel at the level of $27.70 level. A break below this level could strengthen the bearish bias and drive the asset’s price toward throwback support $26.50 level.
On the upside, the Silver price tests an immediate resistance at the upper boundary of the descending channel around the nine-day Exponential Moving Average (EMA) at the $28.97 level. A breakthrough above the latter could lead the XAG/USD pair to explore the region around the three-month high at the $31.76 level.
XAG/USD: Daily Chart