Gold price struggles to gain ground ahead of US PCE data


- Gold price drifts lower in Friday’s Asian session.
- The stronger US GDP growth drags Gold price lower, but rising Fed rate cut expectations might help limit its losses.
- All eyes are on the US PCE inflation data, which is due later on Friday.
Gold price (XAU/USD) loses momentum amid the firmer US Dollar (USD) on Friday. The upbeat US growth report and Initial Jobless Claims have pushed back the expectation of a deeper rate cut by the US Federal Reserve (Fed) in September, which weighs on the non-yielding gold. Nonetheless, the escalating geopolitical tensions in the Middle East and the war between Russia and Ukraine might boost the safe-haven demand, benefiting the yellow metal.
Investors will closely monitor the US inflation data for further insights on the potential size of the Fed rate cut. The core Personal Consumption Expenditures (PCE) Price Index, the Fed's preferred gauge of inflation, is estimated to show an increase of 2.7% YoY in July, compared to 2.6% in June. A softer-than-expected PCE reading could trigger the Fed to start a rate-cutting cycle, which acts as a tailwind for XAU/USD.
Daily Digest Market Movers: Gold price loses traction, reaffirmed Fed rate cut bets might cap its downside
- Russia carried out several air attacks on Ukraine this week, costing Moscow an estimated £1.1 billion. Meanwhile, Ukraine has warned it is closely watching its border with Belarus after a recent buildup of troops there, per Sky News.
- US Gross Domestic Product (GDP) grew at an annual rate of 3.0% in the second quarter (Q2), the Department of Commerce reported in its second estimate released on Thursday. The figure came in stronger than the estimations and the initial estimate of 2.8%.
- The US weekly Initial Jobless Claims for the week ending August 24 declined to 231K from 233K in the previous week, below the market consensus of 232K.
- Atlanta Fed President Raphael Bostic said on Thursday that it might be "time to move" on rate cuts as inflation cools down further and the unemployment rate rises more than he estimated, but he wants to see more evidence from the monthly jobs report and two inflation reports due before the next Fed meeting.
- The markets are now pricing in around 66% of a 25 basis points (bps) rate cut in September, but the possibility of a larger rate cut stands at 34%, down from 36.5% before the US GDP data, according to the CME FedWatch Tool.
Technical Analysis: Gold price keeps the bullish vibe in the longer term
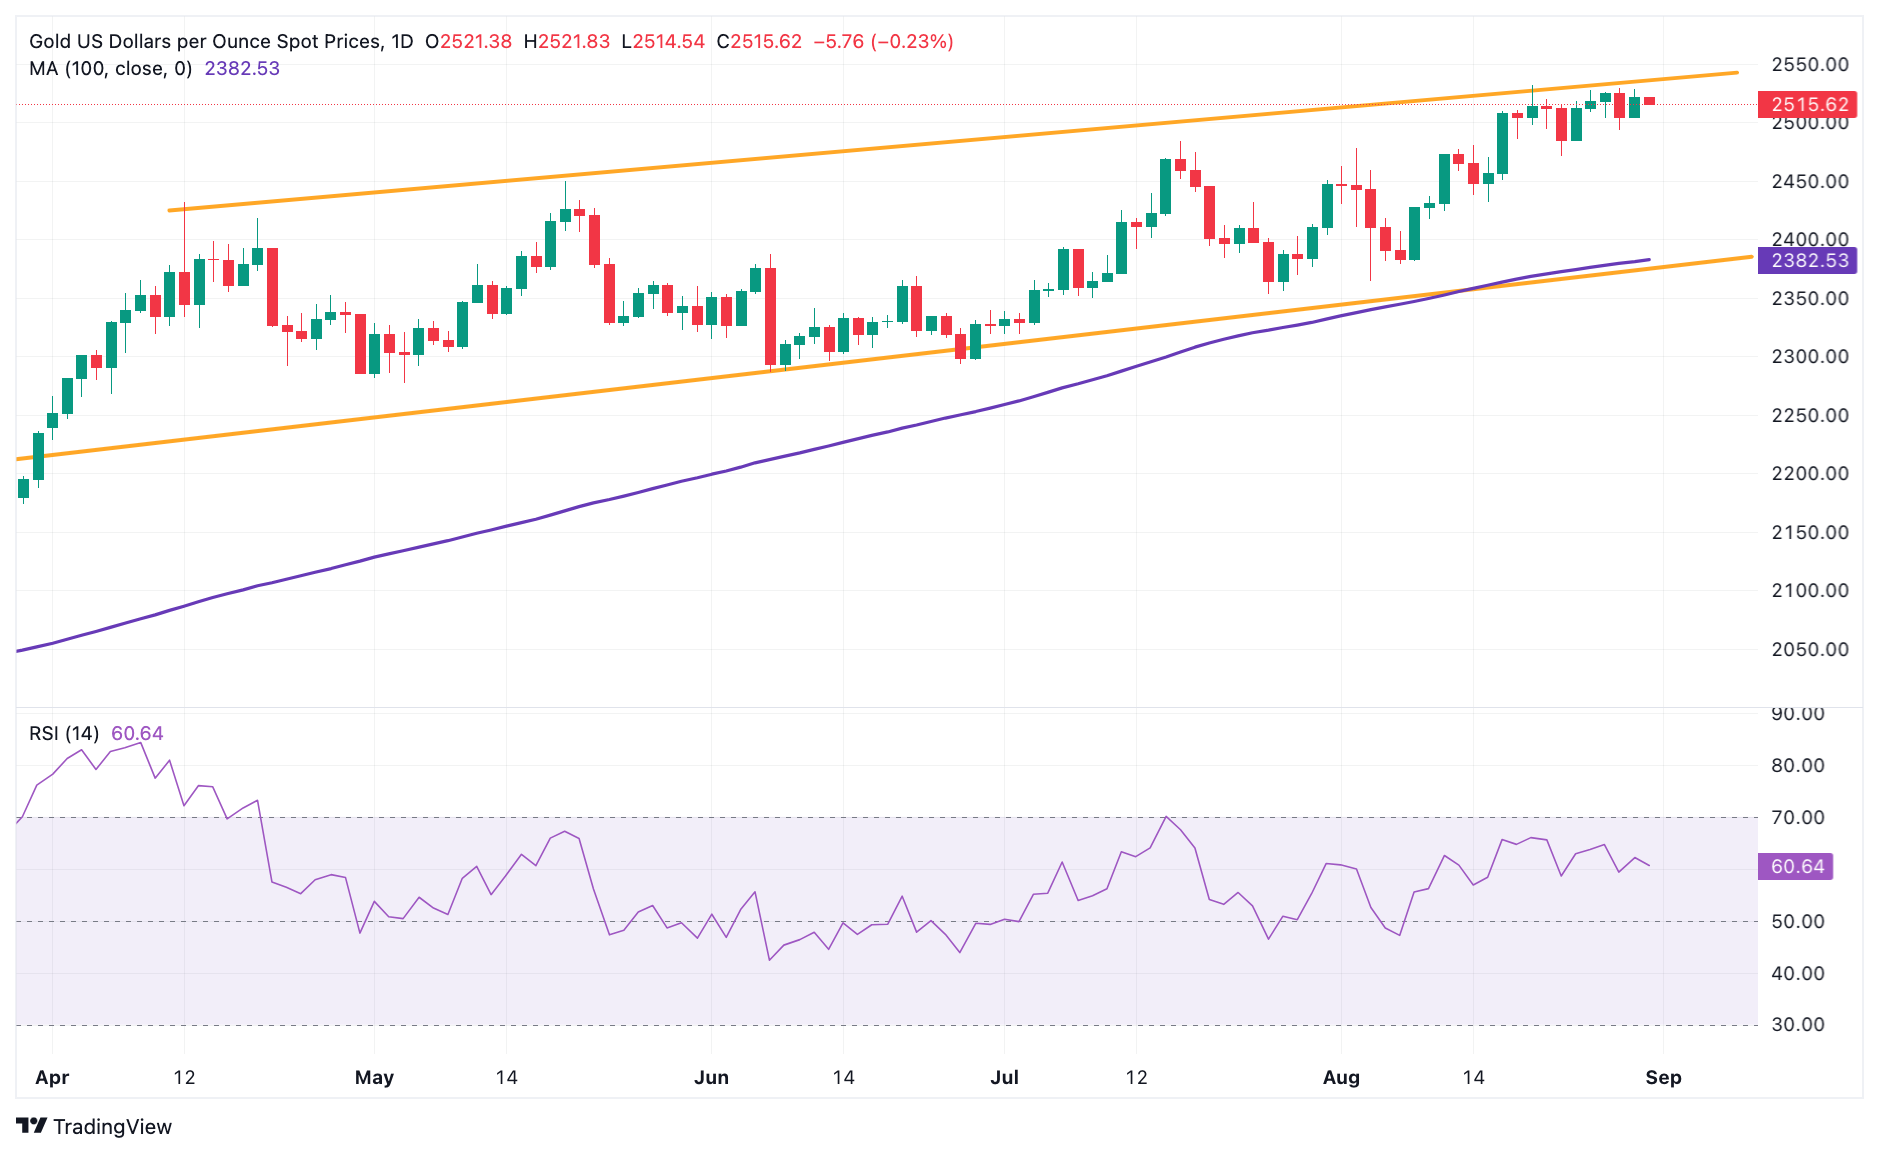
The Gold price edges lower on the day. The precious metal remains capped under a five-month-old ascending channel upper boundary and the all-time high. However, the overall outlook of the precious metal is strongly in favor of the bulls on the daily timeframe, with the price holding above the key 100-day Exponential Moving Average (EMA). Additionally, the 14-day Relative Strength Index (RSI) stands near 60.75, suggesting potential bullish momentum in the near term.
The key resistance level for the yellow metal is seen near the confluence of the all-time high and the upper boundary of the trend channel of $2,530. Further north, the next hurdle emerges at the $2,600 psychological mark.
On the other hand, the initial downside target for XAU/USD could be the $2,500 round figure. A decisive break below this level could expose further downside potential towards $2,432 (the low of August 15) en route to $2,382 (100-day EMA).
US Dollar price today
The table below shows the percentage change of US Dollar (USD) against listed major currencies today. US Dollar was the weakest against the .
| USD | EUR | GBP | CAD | AUD | JPY | NZD | CHF |
| USD |
| 0.06% | 0.01% | -0.02% | -0.06% | -0.12% | -0.07% | 0.05% |
| EUR | -0.05% |
| -0.04% | -0.08% | -0.13% | -0.18% | -0.14% | -0.03% |
| GBP | -0.01% | 0.04% |
| -0.04% | -0.08% | -0.14% | -0.09% | 0.01% |
| CAD | 0.02% | 0.08% | 0.04% |
| -0.05% | -0.10% | -0.06% | 0.05% |
| AUD | 0.08% | 0.13% | 0.09% | 0.05% |
| -0.05% | -0.01% | 0.08% |
| JPY | 0.12% | 0.18% | 0.15% | 0.09% | 0.06% |
| 0.05% | 0.15% |
| NZD | 0.08% | 0.14% | 0.09% | 0.06% | 0.01% | -0.03% |
| 0.13% |
| CHF | -0.05% | 0.02% | -0.01% | -0.05% | -0.08% | -0.14% | -0.10% |
|
The heat map shows percentage changes of major currencies against each other. The base currency is picked from the left column, while the quote currency is picked from the top row. For example, if you pick the Euro from the left column and move along the horizontal line to the Japanese Yen, the percentage change displayed in the box will represent EUR (base)/JPY (quote).