Gold slides on reduced haven demand, better US data


- Gold edges lower as a result of easing hostilities in the Middle East and better-than-expected US economic data.
- US Durable Goods Orders smashed estimates on Monday, dispelling some of the pessimism around the US economy.
- Despite risk of a correction from overweight long positions, TD Securities expects Gold to reach a long-term target of $2,700.
Gold (XAU/USD) trades marginally lower in the $2,510s on Tuesday as tensions in the Middle East dissipate, reducing haven demand for the yellow metal. This comes after Israel and Hezbollah’s tit-for-tat missile exchange fails to escalate, though ongoing threats from Iran hover.
Gold may also be edging lower after the release of better-than-expected US Durable Goods Orders data on Monday. The 9.9% rise recorded in July was the highest reading since May 2020 and helped dispel some of the pessimism surrounding the US economy. This, in turn, probably acted as an antidote to expectations the Federal Reserve (Fed) will need to cut interest rates aggressively to avoid a hard landing.
A more gradual programme of cuts would limit the upside for Gold, which is a non-interest paying asset that tends to be viewed more attractively the lower rates are.
The probability of the Fed making a mega 0.50% interest rate cut in September rather than the standard 0.25% reduction has eased back down below 30%. It had risen up to around 35% after Federal Reserve (Fed) Chairman Jerome Powell made the clearest signal yet that cuts were in pipeline at his speech in Jackson Hole on Friday.
Gold slips on reduced haven demand, strong US data
Gold edges lower on Tuesday as safety demand eases. US Air Force General C.Q. Brown, chairman of the Joint Chiefs of Staff, said early Tuesday that fears of a near-term broader Middle East conflict between Israel and Lebanon’s Hezbollah have eased following a lack of escalation. Nonetheless, the US top General warned that “Iran still poses a significant danger as it weighs a strike on Israel,” according to Reuters.
The US Dollar Index (DXY), which measures the strength of the Dollar against a trade-weighted basket, is off its lows, recovering marginally to 100.88 on Tuesday. Gold is negatively correlated to the US Dollar (USD) as it is priced in USD.
Gold to rally in medium-term but risk of correction looms – TD Securities
Gold is likely to go higher but is also at risk of a sharp pullback due to extreme long positioning, according to Bart Melek, Head of Commodity Strategy at TD Securities.
“More upside is in the cards in coming months, but fund heavy long positioning represents a short-term correction risk,” says the strategist.
Given the Fed’s new focus is on its other mandate to provide “full employment”, there is a risk that strong employment figures could trigger an unwinding of these longs and a correction.
“A stronger-than-expected Payrolls print or any other event, which reduces the expectations of rate cuts, could trigger these players to take profits, causing a significant correction,” adds Malek.
TD Securities’ long-term upside target for Gold is $2,700, with the potential for major central bank players such as the People’s Bank of China (PBoC) providing the demand to push the precious metal up to those highs.
One possibility might be that the PBoC (and other major investors) who stopped accumulating Gold back in May – presumably because it was hoping prices would come back down to more favorable levels – may decide not to wait any longer due to fear of missing out, and start buying at current levels again, adds Malek.
Technical Analysis: Gold consolidates above top of former range
Gold (XAU/USD) continues trading above support from the top of its old range. Despite trading sideways recently, the pair remains in a short-term uptrend and given “the trend is your friend” this continues to favor longs over shorts.
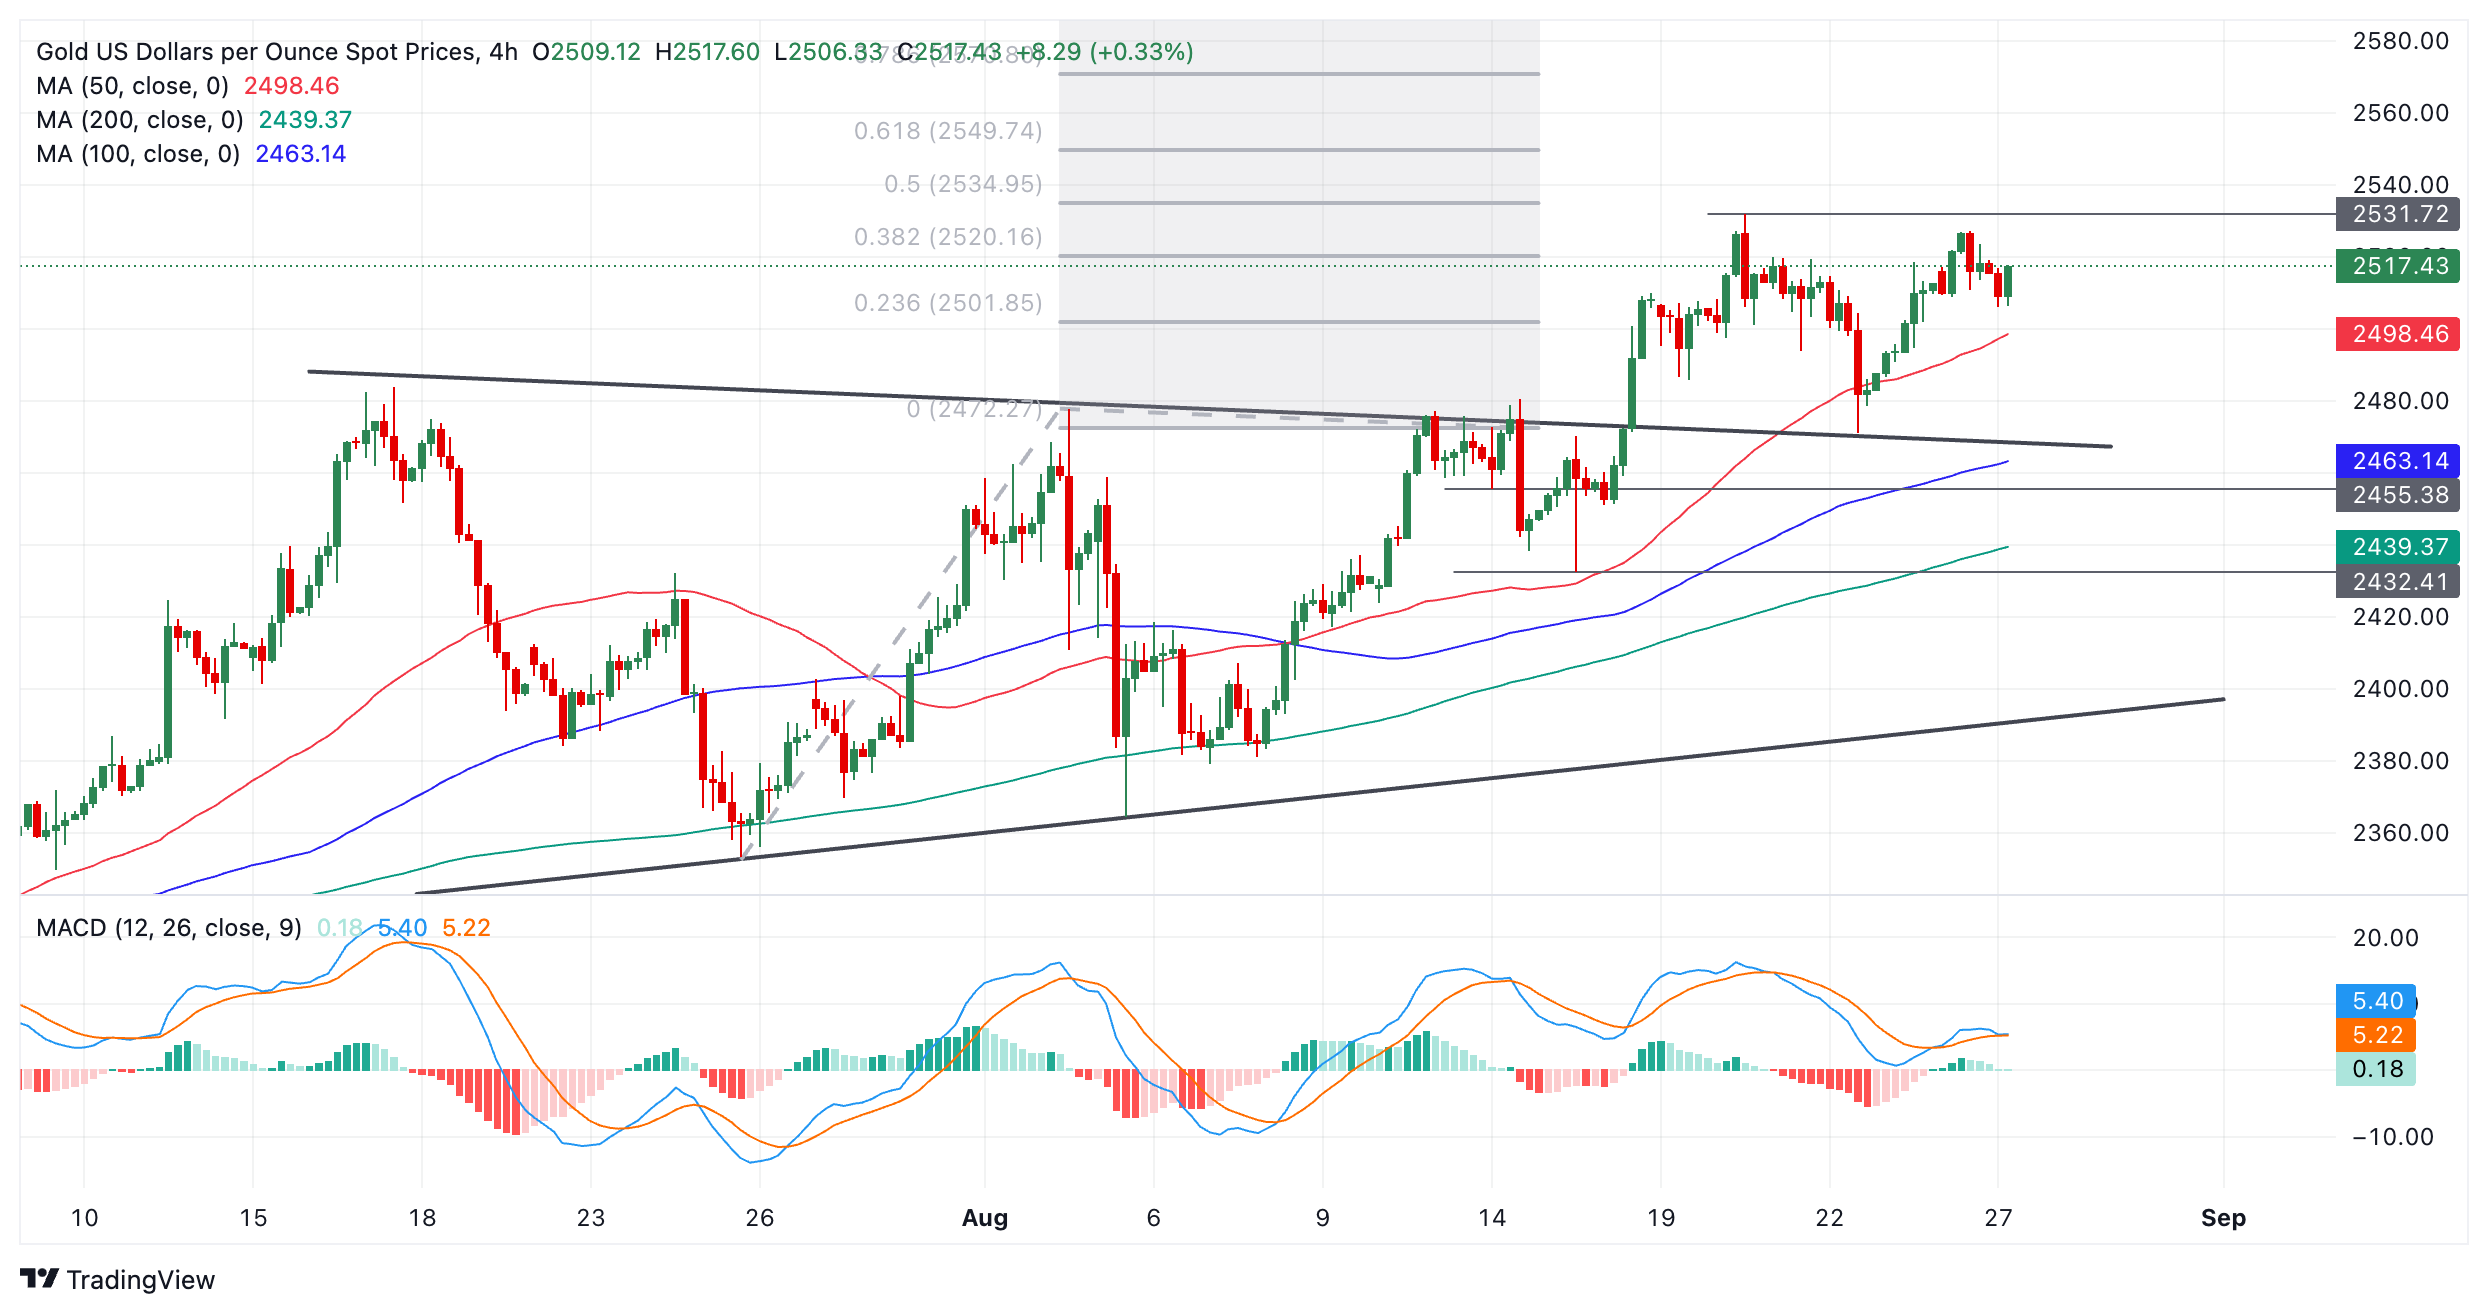
XAU/USD 4-hour Chart
The breakout of the range, which looks like an incomplete triangle pattern, on August 14 generated an upside target at roughly $2,550. This was calculated by taking the 0.618 Fibonacci ratio of the range’s height and extrapolating it higher. This target is the minimum expectation for a follow-through after a breakout based on principles of technical analysis.
A break above the $2,531 all-time high from August 20 would provide added confirmation of a continuation higher towards the $2,550 target.
Alternatively, a break back inside the range would negate the upside projected target. Such a move would be confirmed on a close below $2,470 (August 22 low). It would change the picture for Gold and bring the short-term uptrend into doubt.
Gold is in a broad uptrend on medium and long-term time frames, however, which further supports an overall bullish outlook for the precious metal.
Economic Indicator
Durable Goods Orders
The Durable Goods Orders, released by the US Census Bureau, measures the cost of orders received by manufacturers for durable goods, which means goods planned to last for three years or more, such as motor vehicles and appliances. As those durable products often involve large investments they are sensitive to the US economic situation. The final figure shows the state of US production activity. Generally speaking, a high reading is bullish for the USD.
Read more.
Last release: Mon Aug 26, 2024 12:30
Frequency: Monthly
Actual: 9.9%
Consensus: 4%
Previous: -6.6%
Source: US Census Bureau