Silver Price Forecast: XAG/USD tests 14-day EMA at $28.00

- Silver price faces immediate resistance around the 14-day EMA at $28.00 level.
- The daily chart analysis indicates a breakout above a descending triangle, suggesting a potential bullish trend reversal.
- The upper boundary of the descending triangle around the $27.75 level acts as immediate support.
Silver price (XAG/USD) price retraces its recent gains, trading around $27.90 per troy ounce during the European session on Wednesday. The analysis of the daily chart shows a breakout above a descending triangle pattern, which is considered a positive signal. This breakout suggests that the market may be shifting from a bearish to a bullish bias.
Additionally, the 14-day Relative Strength Index (RSI) is consolidating below 50 level, suggesting a downward trend. A break above the 50 level would indicate the emergence of an upward trend.
Additionally, the Moving Average Convergence Divergence (MACD) line has crossed above the signal line, suggesting a potential bullish signal. However, since both lines remain below the centerline (zero line), this indicates that the overall trend is still bearish. It might be wise to wait for further confirmation before making any significant trading decisions.
In terms of support, the Silver price is testing the upper boundary of the descending triangle around the $27.75 level. A return to the descending triangle would reinforce the bearish bias and push the metal asset to navigate the region around the $26.60 level, followed by May’s low at the $26.02 level.
On the upside, the Silver price tests an immediate resistance around the 14-day Exponential Moving Average (EMA) at the $28.00 level, followed by the “throwback support turned resistance” at the $28.60 level. A breakthrough above the latter could lead the XAG/USD pair to explore the region around the two-month high at the $31.75 level.
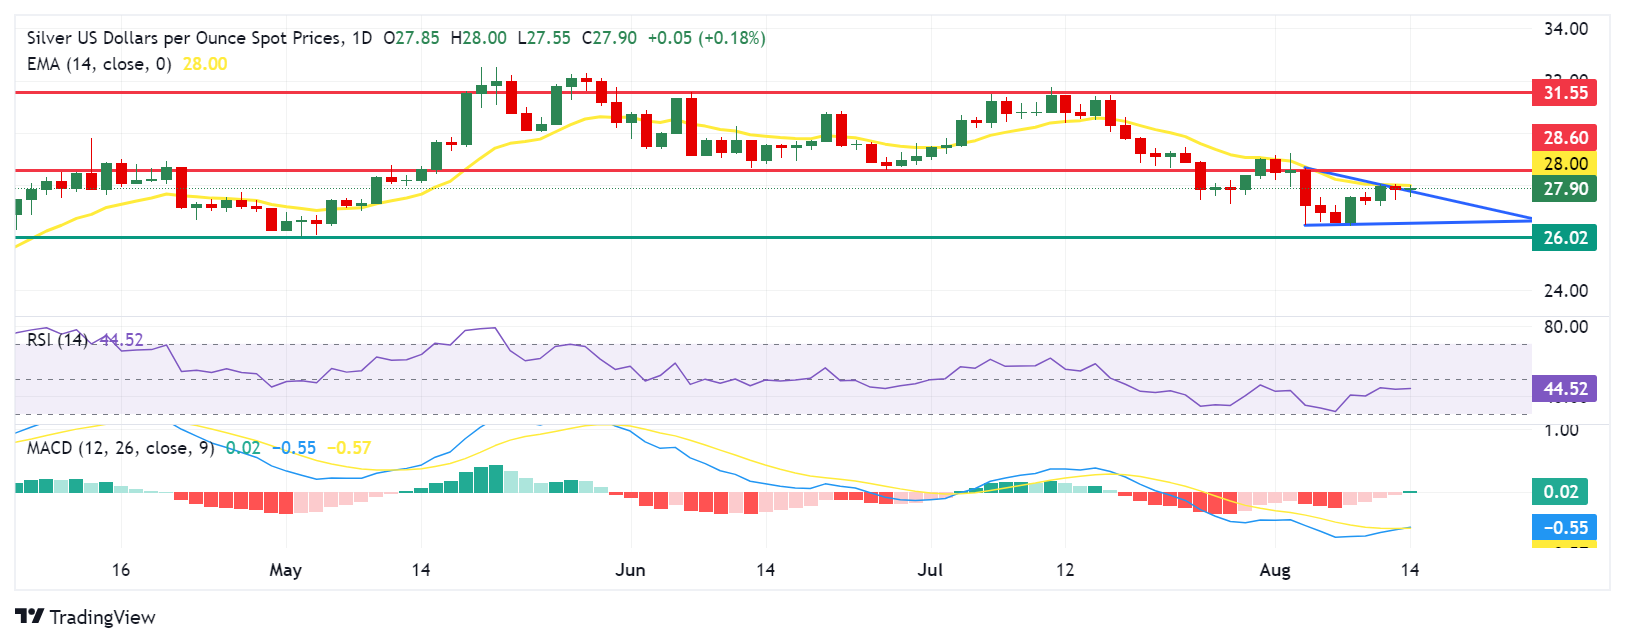
XAG/USD: Daily Chart
Silver FAQs
Why do people invest in Silver?
Silver is a precious metal highly traded among investors. It has been historically used as a store of value and a medium of exchange. Although less popular than Gold, traders may turn to Silver to diversify their investment portfolio, for its intrinsic value or as a potential hedge during high-inflation periods. Investors can buy physical Silver, in coins or in bars, or trade it through vehicles such as Exchange Traded Funds, which track its price on international markets.
Which factors influence Silver prices?
Silver prices can move due to a wide range of factors. Geopolitical instability or fears of a deep recession can make Silver price escalate due to its safe-haven status, although to a lesser extent than Gold's. As a yieldless asset, Silver tends to rise with lower interest rates. Its moves also depend on how the US Dollar (USD) behaves as the asset is priced in dollars (XAG/USD). A strong Dollar tends to keep the price of Silver at bay, whereas a weaker Dollar is likely to propel prices up. Other factors such as investment demand, mining supply – Silver is much more abundant than Gold – and recycling rates can also affect prices.
How does industrial demand affect Silver prices?
Silver is widely used in industry, particularly in sectors such as electronics or solar energy, as it has one of the highest electric conductivity of all metals – more than Copper and Gold. A surge in demand can increase prices, while a decline tends to lower them. Dynamics in the US, Chinese and Indian economies can also contribute to price swings: for the US and particularly China, their big industrial sectors use Silver in various processes; in India, consumers’ demand for the precious metal for jewellery also plays a key role in setting prices.
How do Silver prices react to Gold’s moves?
Silver prices tend to follow Gold's moves. When Gold prices rise, Silver typically follows suit, as their status as safe-haven assets is similar. The Gold/Silver ratio, which shows the number of ounces of Silver needed to equal the value of one ounce of Gold, may help to determine the relative valuation between both metals. Some investors may consider a high ratio as an indicator that Silver is undervalued, or Gold is overvalued. On the contrary, a low ratio might suggest that Gold is undervalued relative to Silver.