tradingkey.logo

Silver Price Analysis: XAG/USD hovers around opening price, flatline

FXStreetAug 5, 2024 12:52 AM

  • Silver hits weekly high of $29.22 before stabilizing at $28.49, down 0.02%.
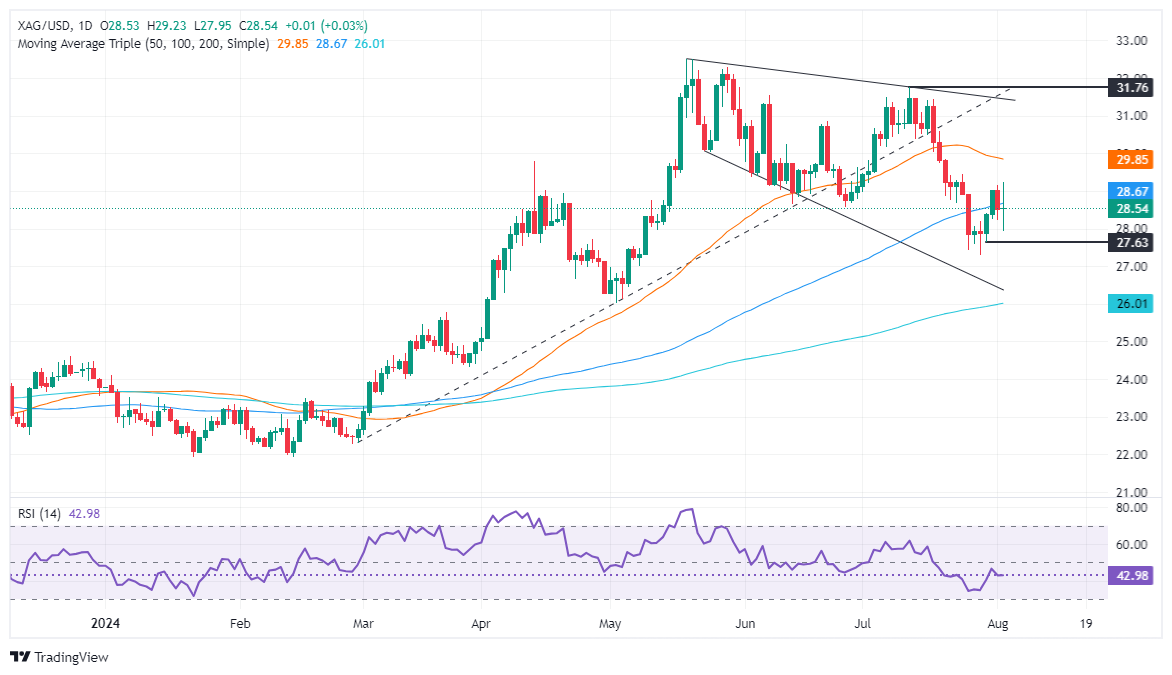
  • Technical outlook: Closing above 100-DMA ($28.69) may trigger rally to $29.00 and $29.50.
  • Bearish scenario if XAG/USD falls below $28.00, targeting $27.95, July 29 low ($27.31), and 200-DMA ($26.00).


Silver's price was virtually unchanged late in the North American session after whipsawing following US Nonfarm Payrolls data. The grey metal-stabilized below the 100-day moving average (DMA) and traded at $28.49, registering minimal losses of 0.02%.


XAG/USD Price Analysis: Technical outlook


Silver trades at around its opening price after hitting a new weekly high of $29.22, a move that was quickly rejected amid profit-taking in the precious metal segment, led by Gold. The XAG/USD dived below $28.00 following the spike on NFP release before buyers recovered the latter and lifted spot prices to the current price level.


If Silver closes above the 100-DMA at $28.69, that could sponsor a rally toward $29.00 in the upcoming week, followed by the $29.50 mark, which capped prices from July 22 to 24, before collapsing.


Conversely, bears would be in play if they drag XAG/USD below $28.00, exposing the day’s low of $27.95. Further losses hover underneath that level and push Silver to test the July 29 bottom at $27.31, ahead of dropping to the 200-DMA at $26.00.


XAG/USD Price Action – Daily Chart

Disclaimer: The content of this article solely represents the author's personal opinions and does not reflect the official stance of Tradingkey. It should not be considered as investment advice. The article is intended for reference purposes only, and readers should not base any investment decisions solely on its content. Tradingkey bears no responsibility for any trading outcomes resulting from reliance on this article. Furthermore, Tradingkey cannot guarantee the accuracy of the article's content. Before making any investment decisions, it is advisable to consult an independent financial advisor to fully understand the associated risks.
tradingkey.logo
tradingkey.logo
Intraday Data provided by Refinitiv and subject to terms of use. Historical and current end-of-day data provided by Refinitiv. All quotes are in local exchange time. Real-time last sale data for U.S. stock quotes reflect trades reported through Nasdaq only. Intraday data delayed at least 15 minutes or per exchange requirements.
* References, analysis, and trading strategies are provided by the third-party provider, Trading Central, and the point of view is based on the independent assessment and judgement of the analyst, without considering the investment objectives and financial situation of the investors.
Risk Warning: Our Website and Mobile App provides only general information on certain investment products. Finsights does not provide, and the provision of such information must not be construed as Finsights providing, financial advice or recommendation for any investment product.
Investment products are subject to significant investment risks, including the possible loss of the principal amount invested and may not be suitable for everyone. Past performance of investment products is not indicative of their future performance.
Finsights may allow third party advertisers or affiliates to place or deliver advertisements on our Website or Mobile App or any part thereof and may be compensated by them based on your interaction with the advertisements.
© Copyright: FINSIGHTS MEDIA PTE. LTD. All Rights Reserved.