Gold price slumps amid buoyant US Dollar after soft ISM PMI


- Gold price falls, after hitting a daily high of $2,462.
- ISM report shows manufacturing activity at recessionary levels, spurring economic fears.
- US jobless claims rise, highlighting labor market weakness; geopolitical tensions in the Middle East add to safe-haven demand for Gold and USD.
Gold price edges lower during the North American session after hitting a daily low and high of $2,430 and $2,462, respectively, amid a stronger US Dollar. The Greenback recovered after data showed that business activity in the manufacturing sector contracted, while US jobs data underscored the weak labor market. At the time of writing, the XAU/USD trades at $2,438, down 0.35%.
The financial markets turned risk-averse following an Institute for Supply Management (ISM) report that underscored that manufacturing activity in July tumbled to recessionary levels and printed its lowest reading since December 2023. This spurred fears that the Federal Reserve is behind the curve and that the economy could be headed instead for a harder landing.
This is reflected by US equities plunging between 1.56% and 3.27% while US Treasury bond yields sink sharply. This bolstered the golden metal and the Greenback, which investors seek due to their safe-haven status.
The US Bureau of Labor Statistics (BLS) revealed that the number of Americans filling for unemployment benefits rose compared to the previous week’s report and exceeded economists' estimates.
The latest round of data justifies lowering interest rates, but Fed officials have remained skeptical about the disinflation process and stated they would like to see more data.
Another reason driving precious metals prices is geopolitical risks. Tensions in the Middle East remain high after Hezbollah’s attacks on Israel over the weekend and the retaliation of the latter, which killed senior Hamas and Hezbollah officials.
Ahead of the week, Friday’s July Nonfarm Payrolls report will be a crucial piece of the puzzle as the Fed pivots toward becoming more concerned about employment. At the time of writing, market participants had priced 80 basis points (bps) of easing toward the end of 2024.
Daily digest market movers: Gold price drops amid recession fears
- The Federal Reserve decided to hold rates unchanged but indicated that favorable data on inflation and further weakening in the labor market could prompt action.
- US Initial Jobless Claims for the week ending July 27 jumped to 248K, above estimates of 236K and the prior week’s 235K.
- The Institute for Supply Management (ISM) Manufacturing PMI for July fell deeper into contractionary territory from 48.5 to 46.8 and missed estimates for an expansion to 48.8, marking the lowest reading since December 2023.
- The CME FedWatch tool shows that the central bank will reduce interest rates by 25 basis points (bps) from their current levels in the September meeting.
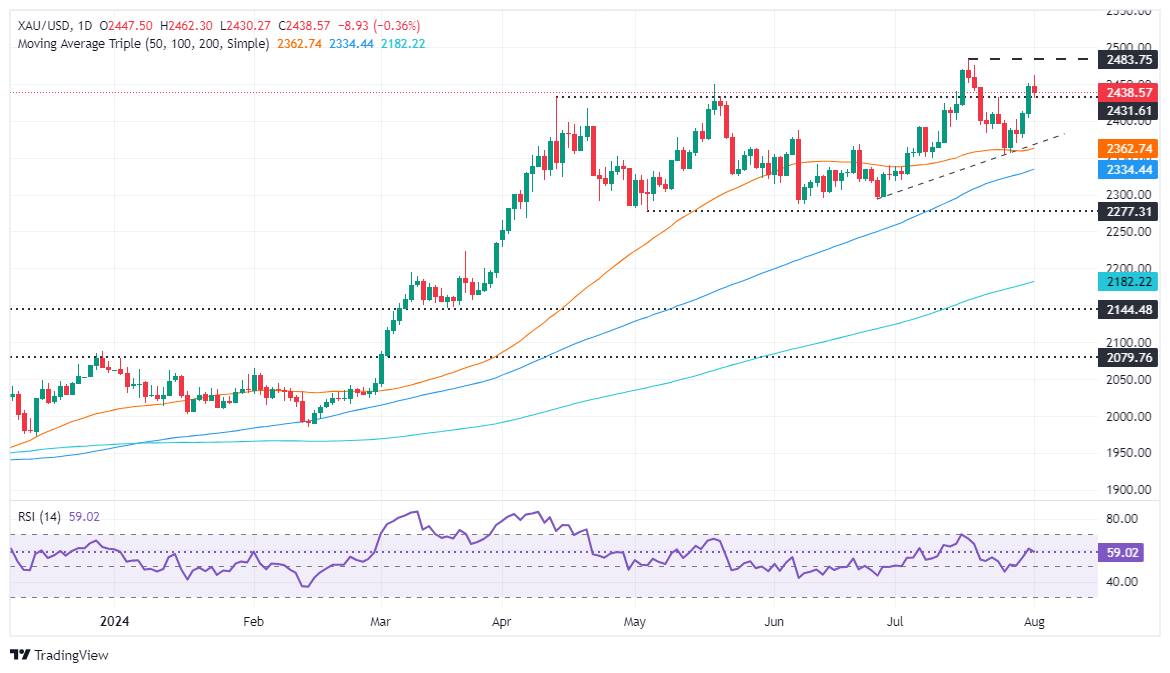
Technical analysis: Gold price trips down below $2,450
Gold price uptrend remains intact, yet buyers face stir resistance around weekly highs, which could pave the way for a pullback. Buying momentum has faded, as depicted by the Relative Strength Index (RSI), aiming lower, opening the door for correction.
If XAU/USD slides below $2,400, that could exacerbate a drop to the July 30 low of $2,376. A further downside is seen if traders clear the 50-day Simple Moving Average (SMA) at $2,362, followed by the 100-day SMA at $2,334.
On the other hand, if XAU/USD climbs past $2,450 and challenges the daily top at $2,462, the all-time high (ATH) at $2,483 is up next, followed by the psychological $2,500 mark