Silver Price Analysis: XAG/USD slides further below $28.00, lowest since May 9


- Silver drifts lower for the second straight day and plummets to a two-and-half-month low.
- The technical setup favors bearish traders and supports prospects for a further downfall.
- Any attempted recovery move is likely to attract fresh sellers near the $28.55-$28.60 area.
Silver (XAG/USD) remains under heavy selling pressure for the second straight day on Thursday and dives to its lowest level since May 9, around the $27.80 region during the Asian session.
From a technical perspective, a sustained breakdown through the $28.65-$28.55 horizontal support, which coincides with the 100-day Simple Moving Average (SMA), could be seen as a fresh trigger for bearish traders. Moreover, oscillators on the daily chart have been gaining negative traction and suggest that the path of least resistance for the XAG/USD is to the downside.
Hence, a further decline towards testing the next relevant support, around the $27.40-$27.30 horizontal resistance breakpoint, en route to the $27.00 mark, looks like a distinct possibility. The downward trajectory could extend further toward the $26.60-$26.55 intermediate support before the XAG/USD eventually drops to the 200-day SMA, currently pegged near the $26.00 mark.
On the flip side, any meaningful recovery attempt now seems to confront stiff resistance around the $28.55-$28.65 region. The said barrier should act as a key pivotal point, which if cleared decisively might trigger a short-covering rally. The XAG/USD might then climb beyond the $29.00 round figure, towards the $29.40-$29.45 area, or the weekly top, en route to the $29.80 region.
This latter is closely followed by the $30.00 psychological mark, above which the XAG/USD could accelerate the positive move towards the $30.35-$30.40 short-term trading range support breakpoint. The subsequent move up should pave the way for a move towards reclaiming the $31.00 round-figure mark.
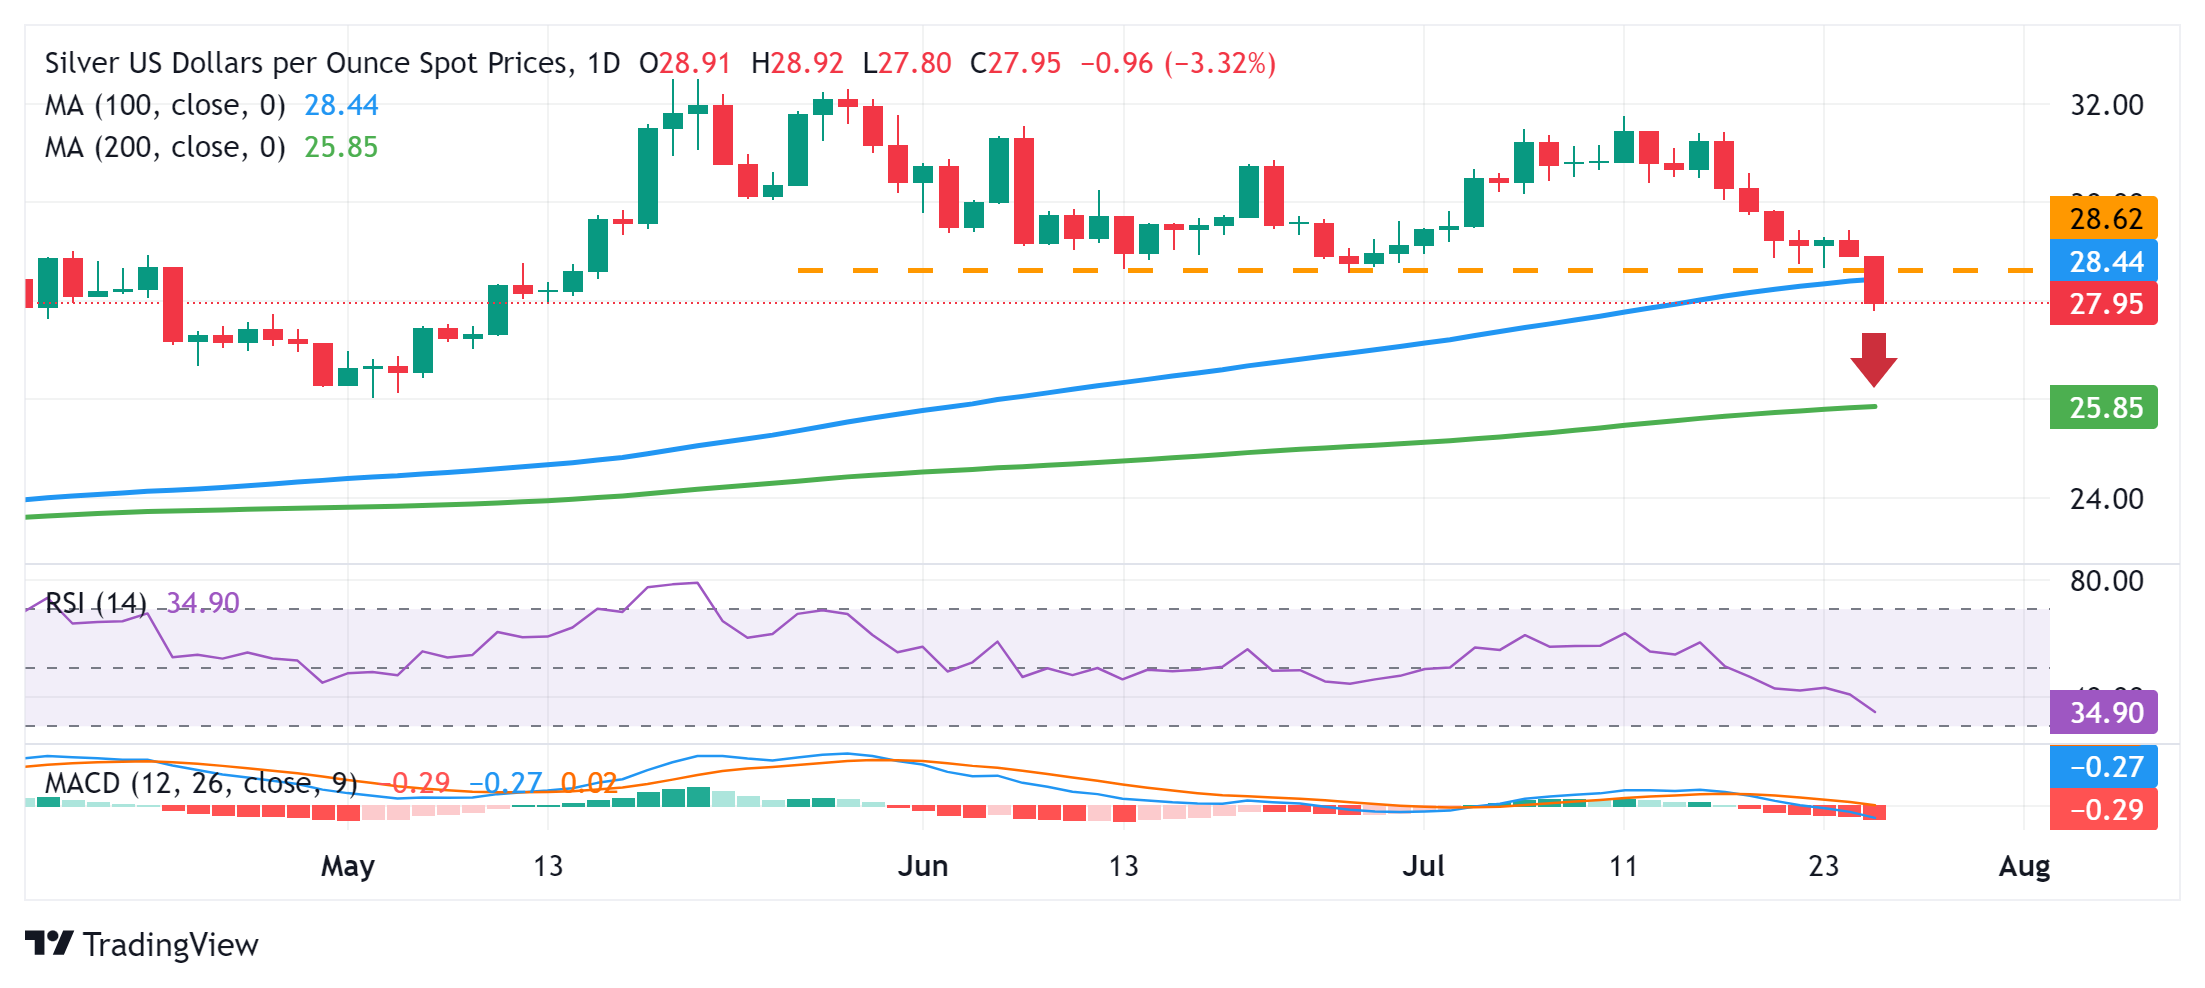
Silver daily chart
Silver FAQs
Why do people invest in Silver?
Silver is a precious metal highly traded among investors. It has been historically used as a store of value and a medium of exchange. Although less popular than Gold, traders may turn to Silver to diversify their investment portfolio, for its intrinsic value or as a potential hedge during high-inflation periods. Investors can buy physical Silver, in coins or in bars, or trade it through vehicles such as Exchange Traded Funds, which track its price on international markets.
Which factors influence Silver prices?
Silver prices can move due to a wide range of factors. Geopolitical instability or fears of a deep recession can make Silver price escalate due to its safe-haven status, although to a lesser extent than Gold's. As a yieldless asset, Silver tends to rise with lower interest rates. Its moves also depend on how the US Dollar (USD) behaves as the asset is priced in dollars (XAG/USD). A strong Dollar tends to keep the price of Silver at bay, whereas a weaker Dollar is likely to propel prices up. Other factors such as investment demand, mining supply – Silver is much more abundant than Gold – and recycling rates can also affect prices.
How does industrial demand affect Silver prices?
Silver is widely used in industry, particularly in sectors such as electronics or solar energy, as it has one of the highest electric conductivity of all metals – more than Copper and Gold. A surge in demand can increase prices, while a decline tends to lower them. Dynamics in the US, Chinese and Indian economies can also contribute to price swings: for the US and particularly China, their big industrial sectors use Silver in various processes; in India, consumers’ demand for the precious metal for jewellery also plays a key role in setting prices.
How do Silver prices react to Gold’s moves?
Silver prices tend to follow Gold's moves. When Gold prices rise, Silver typically follows suit, as their status as safe-haven assets is similar. The Gold/Silver ratio, which shows the number of ounces of Silver needed to equal the value of one ounce of Gold, may help to determine the relative valuation between both metals. Some investors may consider a high ratio as an indicator that Silver is undervalued, or Gold is overvalued. On the contrary, a low ratio might suggest that Gold is undervalued relative to Silver.