Silver Price Analysis: XAG/USD flat lines above mid-$29.00s, 50-day SMA holds the key for bulls


- Silver struggles to register any meaningful recovery from a multi-day low touched this Monday.
- The mixed technical setup warrants caution before placing bullish bets around the XAG/USD.
- A convincing break below the 50-day SMA is needed to support prospects for further losses.
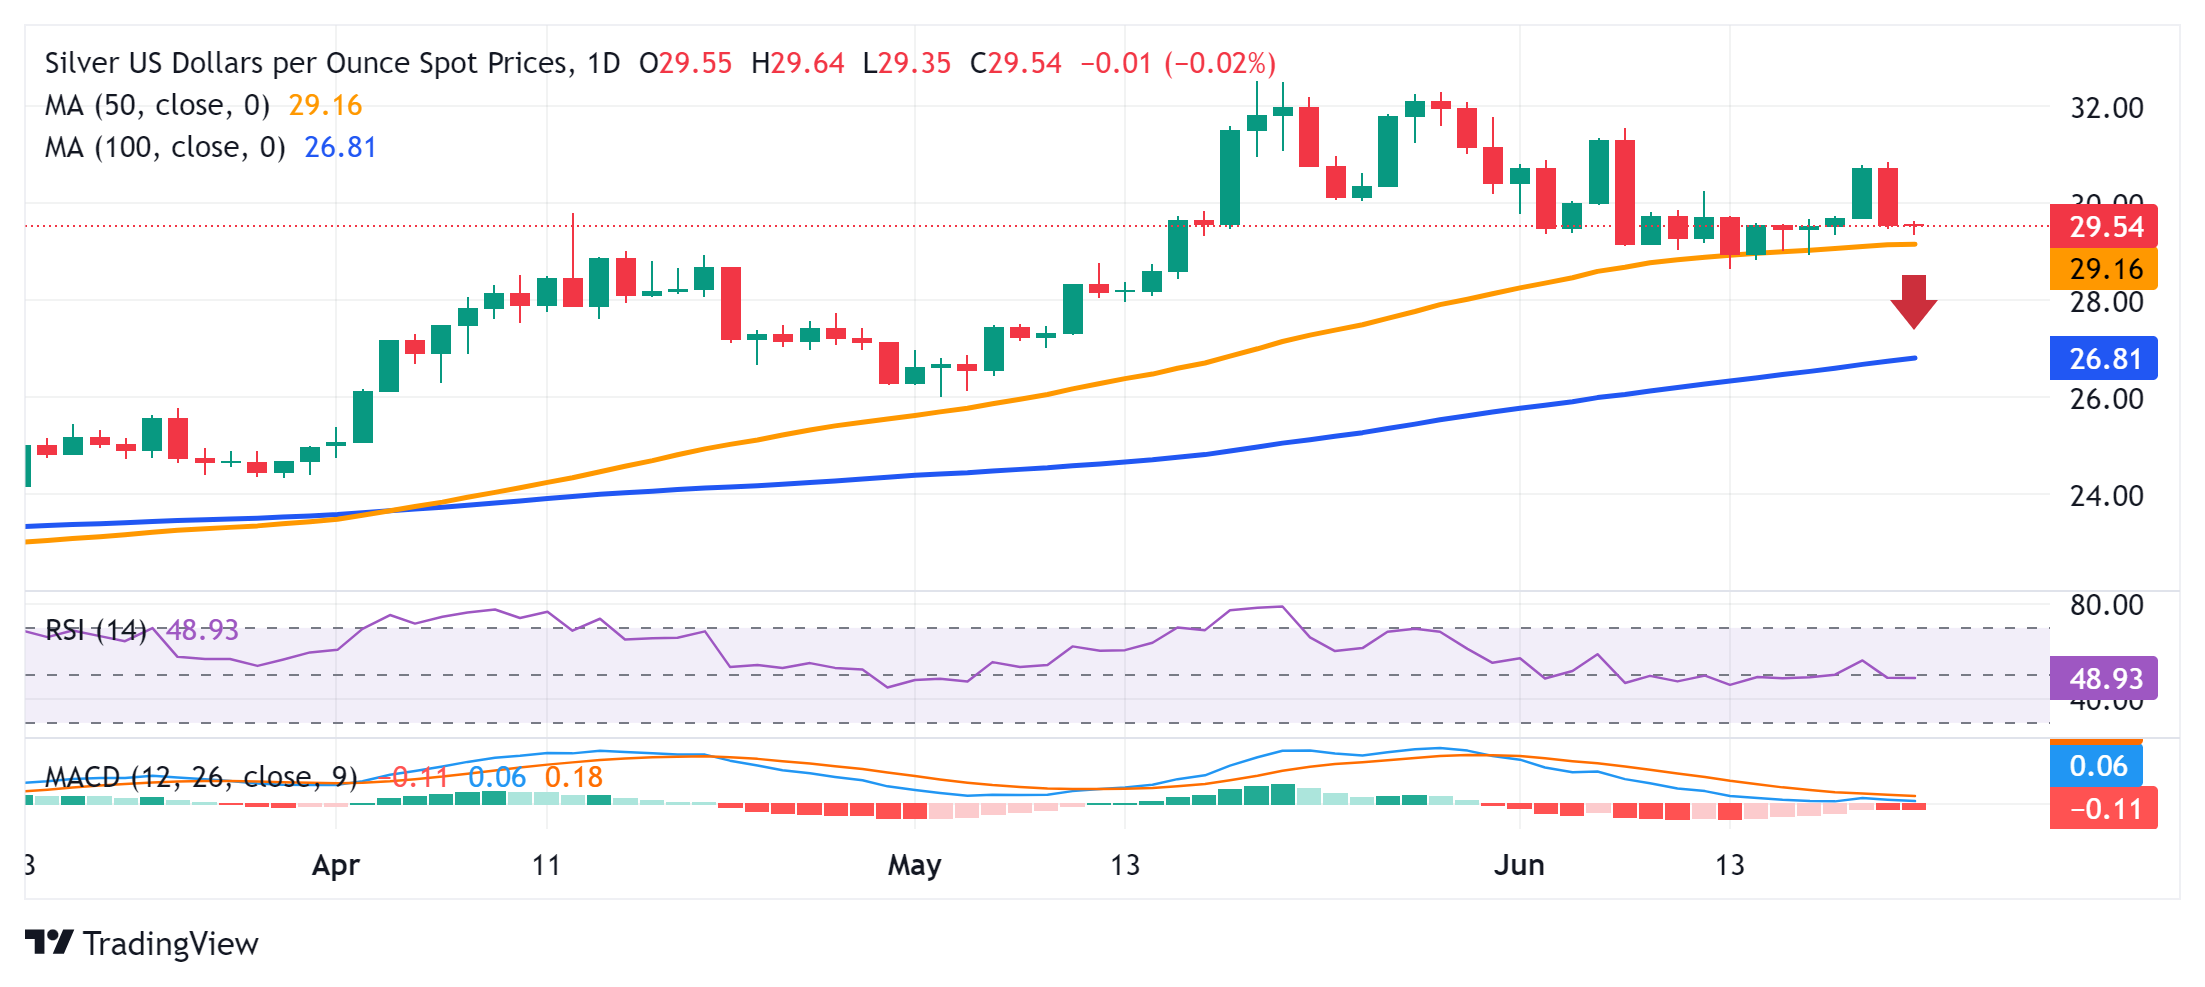
Silver (XAG/USD) finds some support ahead of the 50-day Simple Moving Average (SMA) and stages a modest bounce from a three-day low, around the $29.35 region touched during the Asian session on Monday. The white metal, for now, seems to have stalled its retracement slide from the vicinity of the $31.00 mark, or a two-week high touched on Friday, though struggles to attract any meaningful buyers.
From a technical perspective, the XAG/USD is holding above 50-day, 100-day and 200-day SMAs, which favors bullish traders. That said, oscillators on the daily chart have just started drifting in negative territory and warrant some caution before positioning for any further appreciating move. Meanwhile, the 50-day SMA, currently pegged near the $29.15 area, is likely to protect the immediate downside ahead of the $29.00 round-figure mark.
A convincing break below the latter will shift the near-term bias in favor of bearish traders and set the stage for some meaningful downside. The XAG/USD might then accelerate the fall towards the next relevant support near the $28.30-28.25 region and eventually drop to the $28.00 mark. The downward trajectory could extend further towards the $27.55 support en route to the $27.00 round figure and the 100-day SMA, around the $26.90-26.85 area.
On the flip side, the $30.00 psychological mark might act as an immediate strong barrier ahead of the $30.45-30.50 region. This is followed by the $30.70 supply zone, above which the XAG/USD could aim to surpass the $31.00 round figure and test the next relevant hurdle near the $31.35 area. The subsequent move-up should allow bulls to reclaim the $32.00 mark and retest the $32.50 supply zone, or the YTD peak touched in May.
Silver daily chart
XAG/USD
Overview | |
|---|---|
Today last price | 29.56 |
Today Daily Change | 0.01 |
Today Daily Change % | 0.03 |
Today daily open | 29.55 |
Trends | |
|---|---|
Daily SMA20 | 30.22 |
Daily SMA50 | 29.15 |
Daily SMA100 | 26.74 |
Daily SMA200 | 24.95 |
Levels | |
|---|---|
Previous Daily High | 30.86 |
Previous Daily Low | 29.47 |
Previous Weekly High | 30.86 |
Previous Weekly Low | 28.93 |
Previous Monthly High | 32.51 |
Previous Monthly Low | 26.02 |
Daily Fibonacci 38.2% | 30 |
Daily Fibonacci 61.8% | 30.33 |
Daily Pivot Point S1 | 29.06 |
Daily Pivot Point S2 | 28.57 |
Daily Pivot Point S3 | 27.67 |
Daily Pivot Point R1 | 30.45 |
Daily Pivot Point R2 | 31.34 |
Daily Pivot Point R3 | 31.83 |