XRP Price Shows Resilience: Is a Bold Move Around the Corner?


XRP price extended losses and dived toward the $0.5320 support. The price remained well-bid and is currently attempting a fresh recovery above $0.550.
- XRP price started a decent increase from the $0.5330 zone.
- The price is now trading below $0.560 and the 100-hourly Simple Moving Average.
- There is a new connecting bearish trend line forming with resistance at $0.5570 on the hourly chart of the XRP/USD pair (data source from Kraken).
- The pair could climb higher toward the $0.600 zone if it clears the $0.5620 resistance zone.
XRP Price Attempts Recovery
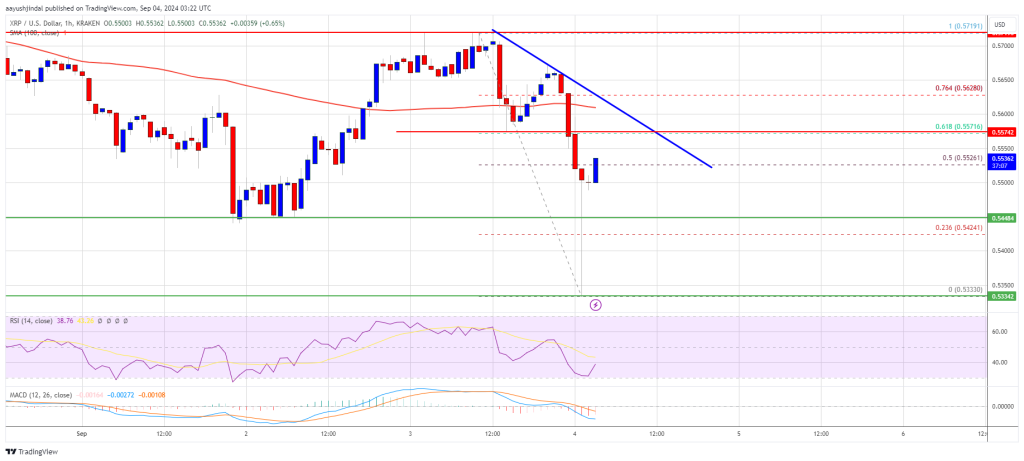
XRP price extended losses like Bitcoin and Ethereum. The price even dived below the $0.5440 support level. It tested the $0.5330 zone. A low was formed at $0.5333 and the price is now attempting a fresh recovery wave.
There was a move above the $0.5420 and $0.5440 resistance levels. The price was able to clear the 23.6% Fib retracement level of the downward move from the $0.5719 swing high to the $0.5333 low. It is also attempting a close above $0.5520.
The price is now trading well below $0.5750 and the 100-hourly Simple Moving Average. On the upside, the price might face resistance near the $0.5550 level. The first major resistance is near the $0.5570 level. There is also a new connecting bearish trend line forming with resistance at $0.5570 on the hourly chart of the XRP/USD pair.
The trend line is close to the 61.8% Fib retracement level of the downward move from the $0.5719 swing high to the $0.5333 low. The next key resistance could be $0.5720. A clear move above the $0.5720 resistance might send the price toward the $0.5850 resistance.
The next major resistance is near the $0.5920 level. Any more gains might send the price toward the $0.600 resistance or even $0.6060 in the near term.
Another Decline?
If XRP fails to clear the $0.5570 resistance zone, it could start another decline. Initial support on the downside is near the $0.5480 level. The next major support is at $0.5420.
If there is a downside break and a close below the $0.5420 level, the price might continue to decline toward the $0.5320 support in the near term. The next major support sits at $0.520.
Technical Indicators
Hourly MACD – The MACD for XRP/USD is now losing pace in the bearish zone.
Hourly RSI (Relative Strength Index) – The RSI for XRP/USD is now below the 50 level.
Major Support Levels – $0.5420 and $0.5320.
Major Resistance Levels – $0.5570 and $0.5720.