Polkadot price forecast: Here’s what needs to happen for DOT/USD to hit $20


Crypto markets have continued their underwhelming performance this week as risk sentiment remains vulnerable ahead of the release of the U.S. inflation report for July.
Polkadot price has also faced pressure, falling around 3% in the past 24 hours to $4.45.
Despite the drop, the altcoin remains up roughly 6% in the past week, marking a notable recovery after dropping to as low as $3.6 at the start of this month.
Optimism surrounds future prospects
Long-term, investors maintain an optimistic view on DOT’s prospects.
Many still believe the Polkadot blockchain ecosystem will be crucial in the Web3 technology revolution, which aims to decentralize the web and empower creators and consumers, moving away from centralized control by major social media platforms.
Investors are also excited about the proposed JAM upgrade, introduced by Polkadot founder Gavin Wood. This project will replace the current central relay chain with the more advanced, flexible JAM network, which promises enhanced security and efficient cross-network communication.
Although JAM is still in development and unlikely to be released before 2025, its potential to boost productivity is expected to support DOT's price growth over time.
DOT/USD technical analysis
Looking back, the Polkadot price reached a peak of $54 in the fall of 2021, just before the onset of the global inflation crisis. Over its four-year history, the average price of Polkadot has been around $13, which is over 190% higher than its current levels.
The recent correction pushed the DOT price towards $3.5, which is a massive horizontal support that will provide a ton of support. A sustainable bounce off of this support zone could result in a move towards the next big resistance block, which sits around $6-7.
More importantly, the bounce off of this important zone has created potential for a double bottom formation. This bullish pattern can be activated if the price action penetrates through the neckline, which sits just below the $12 handle.
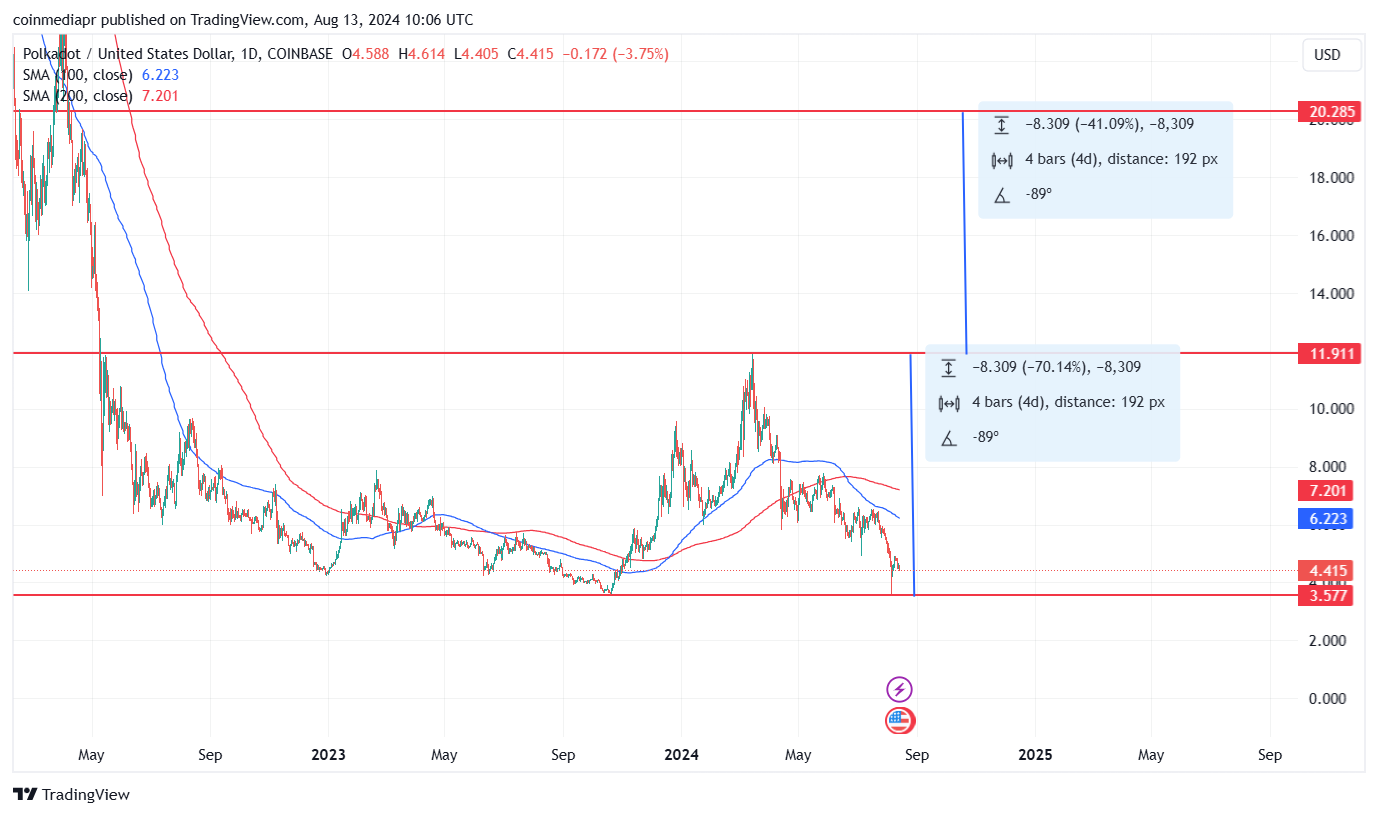
In this case, the Polkadot price is likely to continue rallying and is eventually expected to reach the $20 zone, which would mark the completion of the double bottom pattern. However, this bullish development is contingent on a more favorable risk sentiment.