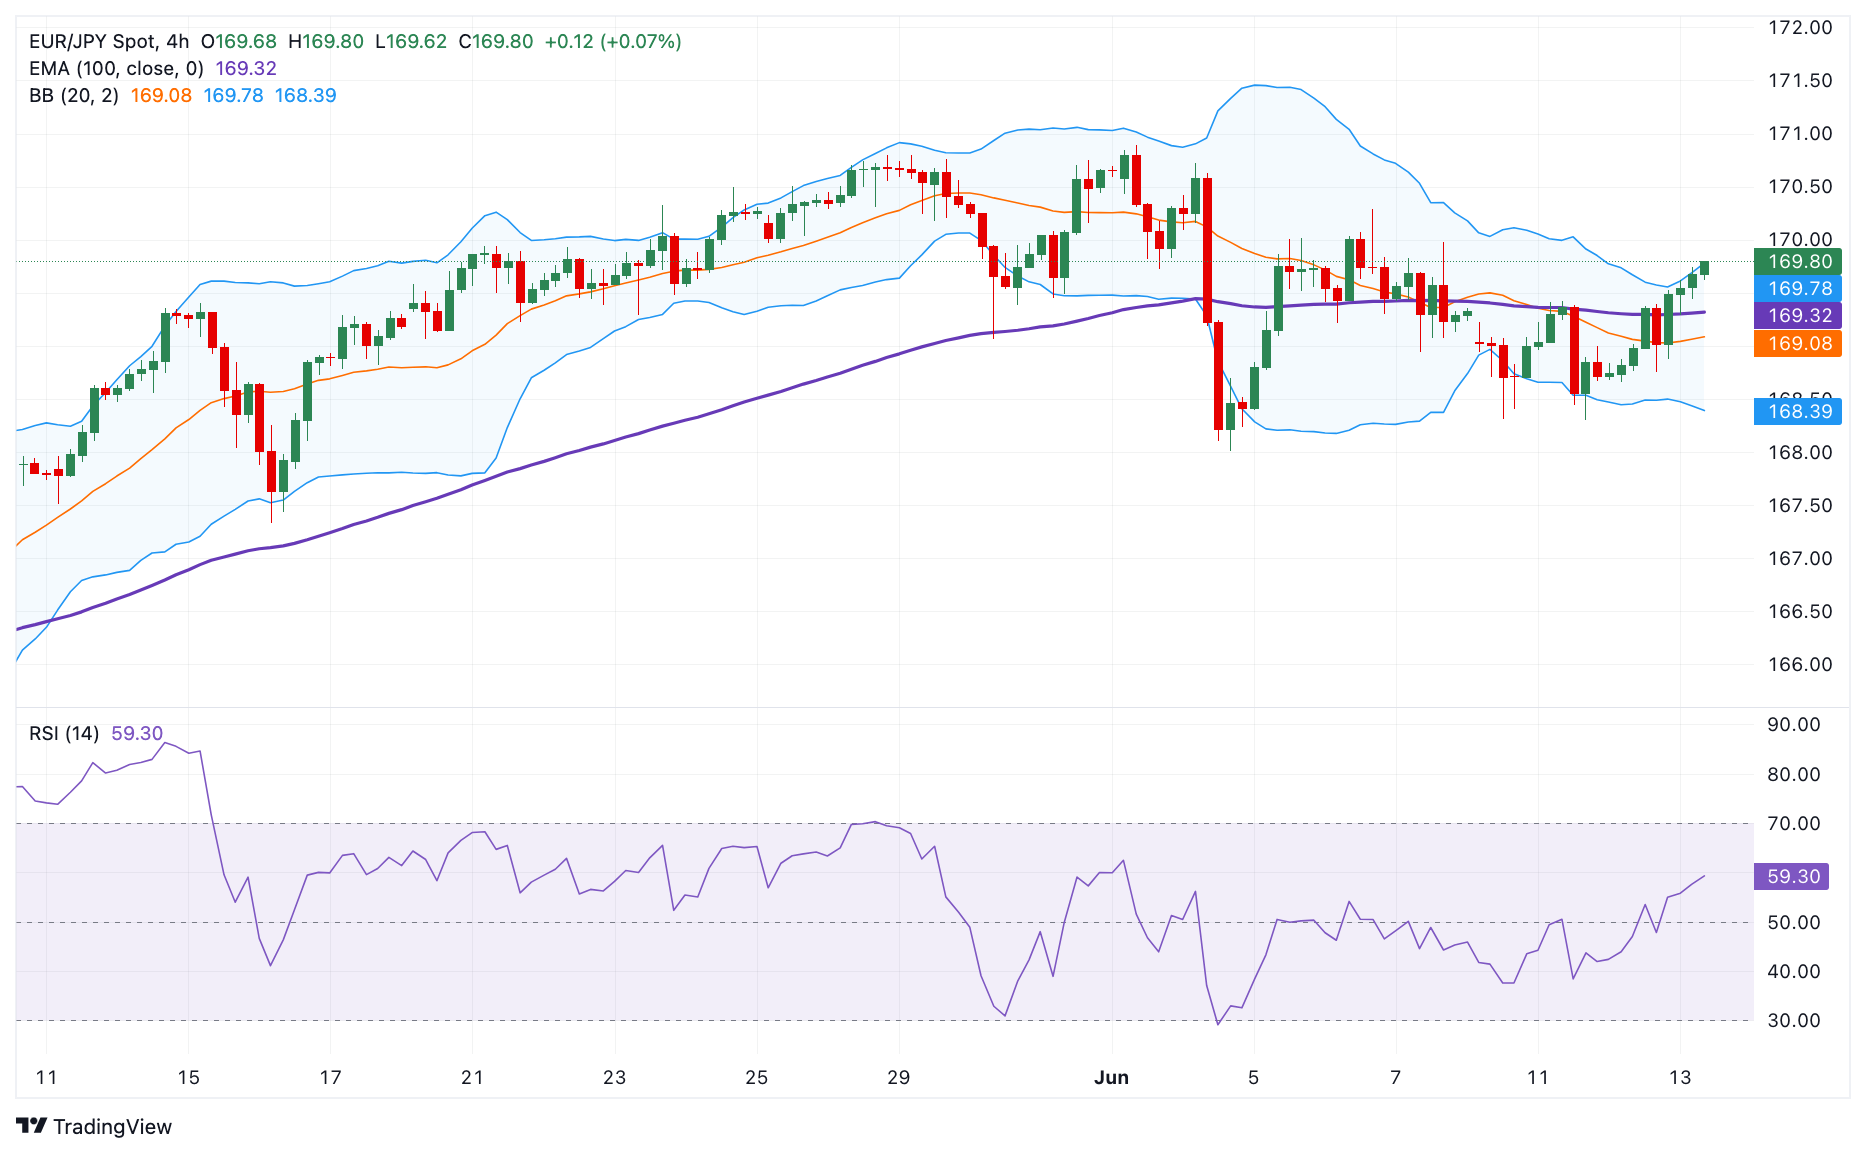
EUR/JPY Price Analysis: The key resistance level is located near 170.00
- EUR/JPY trades on a stronger note near 169.75 in Thursday’s early European session, gaining 0.22% on the day.
- The cross maintains a positive stance above the key 100-period EMA, with a bullish RSI indicator.
- The first upside barrier is seen at the 170.00 psychological mark; the initial support level is seen at 169.32.
The EUR/JPY cross gathers strength around 169.75 during the early European session on Thursday. The uncertainty that the Bank of Japan (BoJ) will announce a reduction in monthly government bond purchases amid a weaker economy continues to undermine the Japanese Yen (JPY) and create a tailwind for EUR/JPY. Market players await the Bank of Japan (BoJ) monetary policy meeting on Friday, which is widely expected to leave interest rates unchanged.
According to the 4-hour chart, EUR/JPY keeps the bullish vibe unchanged as the cross is above the key 100-period Exponential Moving Averages (EMA). The upward momentum is supported by the Relative Strength Index (RSI), which stands in bullish territory near 58.0, supporting the buyers for the time being.
A decisive break above 169.75, the upper boundary of Bollinger Band, will attract some buyers to the 170.00 psychological level. Further north, the additional upside filter to watch is 170.85, a high of June 3, en route to an all-time high of 171.60.
On the downside, the initial support level is located at 169.32, the 100-period EMA. A breach of the mentioned level could pave the way to 168.75, a low of June 12. Extended losses will see a drop to 168.40, the lower limit of Bollinger Band.
EUR/JPY 4-hour chart


