EUR/USD edges higher as traders brace for US inflation, Fed’s decision
- EUR/USD finds support near 1.0710 but the outlook remains uncertain ahead of an eventful New York session.
- The US CPI and the Fed’s dot plot will provide cues about the time frame and number of rate cuts this year.
- ECB policymakers refrain from providing a specific interest-rate path.
EUR/USD edges higher to 1.0750 in Wednesday’s European session ahead of the United States (US) Consumer Price Index (CPI) data for May and the Federal Reserve’s (Fed) interest rate decision, which are scheduled for the American session. The US Dollar Index (DXY), which tracks the Greenback’s value against six major currencies, falls slightly to 105.20.
Investors will pay close attention to US inflation data and the Fed’s dot plot as it is widely expected that the central bank will leave interest rates unchanged in the range of 5.25%-5.50% for the seventh time in a row. The US inflation data will provide cues about when the Fed will start reducing interest rates. The Fed’s dot plot indicates where policymakers see the federal funds rate heading in the medium and long-term time frames.
Economists see US annual core inflation, which strips off volatile food and energy prices, decelerating to 3.5% from April’s reading of 3.6%. In the same period, headline inflation is expected to have grown steadily by 3.4%. Monthly headline CPI is estimated to have grown at a slower pace of 0.1% from 0.3% in April, with core inflation rising steadily by 0.3%.
Currently, financial markets are mixed about the Fed choosing the September meeting as the one in which the central bank will begin cutting interest rates. Traders pared Fed rate-cut bets for September after the US Nonfarm Payrolls (NFP) report for May indicated robust job demand and strong wage growth, which suggested a stubborn inflation outlook.
The new projections for the number of rate cuts are expected to show fewer rate cuts compared to the three predicted In March’s dot plot as officials lose confidence over progress in the disinflation process. Consumer Price Index (CPI) data for the January-March period turned out to be stronger than expected, highlighting the persistence of inflation. However, price pressures abated as expected in April but failed to bring conviction that the disinflation process has resumed.
Daily digest market movers: EUR/USD revives slightly as US Dollar edges down
- EUR/USD finds a cushion and rebounds slightly to 1.0750 despite caution ahead of an eventful New York session and uncertainty surrounding the French elections. Political stability in the Eurozone shaked after French President Emmanuel Macron’s decision to call for a snap election after suffering a defeat by Jordan Bardella-led far-right National Rally, popularly known as Rassemblement National (RN).
- Exit polls on Monday showed that the RN party could win 235 to 265 seats, still short of the 289 needed for an absolute majority, Reuters reported. Analysts see Macron’s decision to call a snap election as a gamble that could further weaken the position of the Centralist alliance.
- Meanwhile, uncertainty over the European Central Bank’s (ECB) interest-rate path appears to be waning as policymakers are holding themselves back from committing to any specific rate-cut trajectory. ECB officials worry that inflation could remain sticky in the next few months due to steady wage growth, which fuels service inflation. In May, Eurozone service inflation rose to 4.1%, the highest in seven months.
- ECB policymaker and Governor of the French central bank Francois Villeroy de Galhau said on Tuesday that he is confident that price pressures will return to its 2% target next year but they have to pass through some bumps in monthly data. "This 'noise' is not very meaningful, and hence we are still more 'outlook driven' and will look still more closely at the inflation forecast,” Villeroy added, according to Reuters.
Technical Analysis: EUR/USD returns inside triangle formation

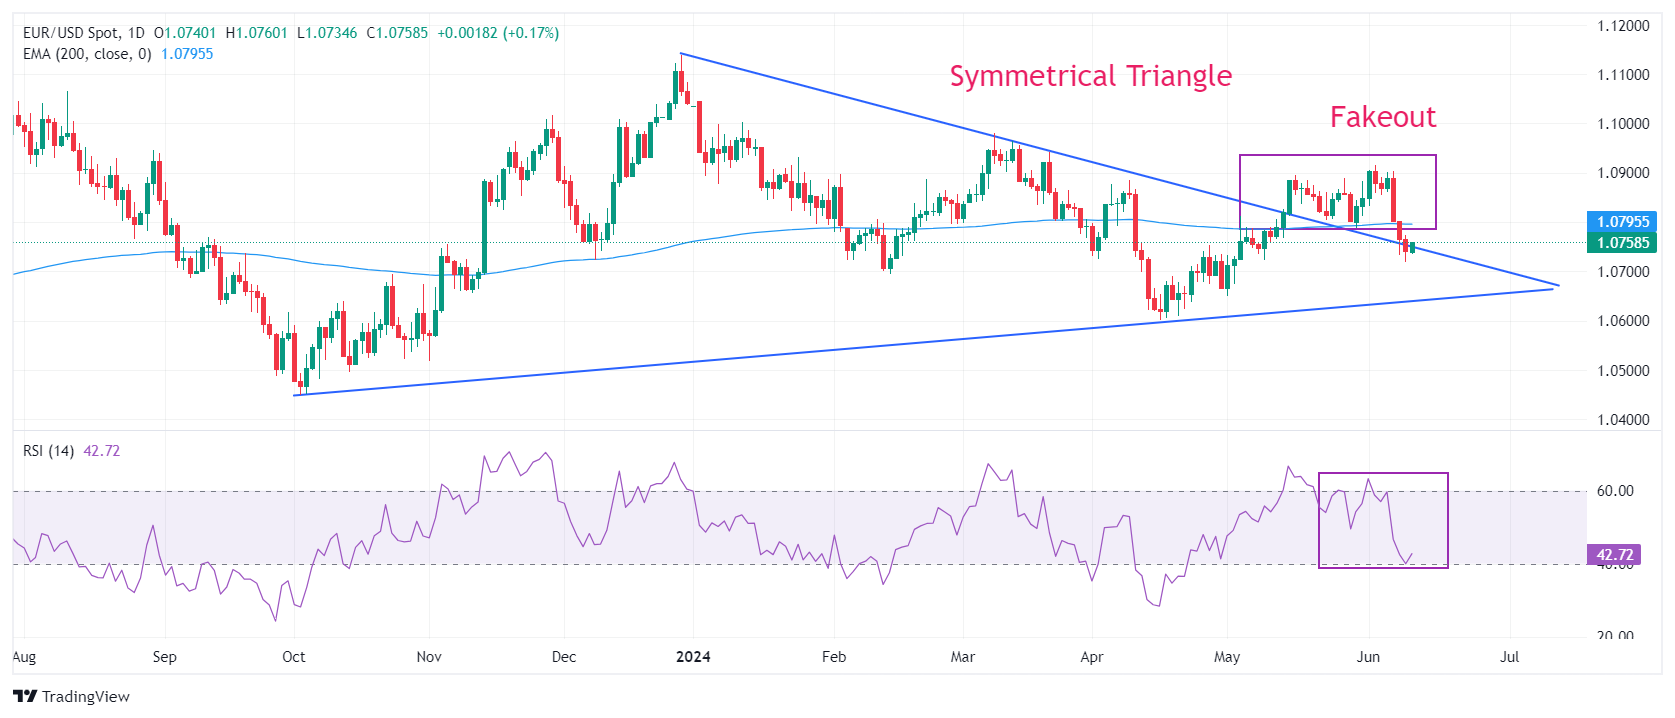
EUR/USD finds temporary support after sliding to an almost five-week low near 1.0710. The near-term outlook of the major currency pair remains downbeat as it has fallen back inside the Symmetrical Triangle chart formation on a daily time frame after a fakeout. The shared currency pair is expected to find support near 1.0636, the upward-sloping order of the above-mentioned chart pattern plotted from 3 October 2023 low at 1.0448.
The long-term outlook of the shared currency pair has also turned negative as it drops below the 200-day Exponential Moving Average (EMA), which trades around 1.0800.
The 14-period Relative Strength Index (RSI) falls sharply to 40.00. A decisive break below the same would trigger a bearish momentum.
Economic Indicator
Fed Interest Rate Decision
The Federal Reserve (Fed) deliberates on monetary policy and makes a decision on interest rates at eight pre-scheduled meetings per year. It has two mandates: to keep inflation at 2%, and to maintain full employment. Its main tool for achieving this is by setting interest rates – both at which it lends to banks and banks lend to each other. If it decides to hike rates, the US Dollar (USD) tends to strengthen as it attracts more foreign capital inflows. If it cuts rates, it tends to weaken the USD as capital drains out to countries offering higher returns. If rates are left unchanged, attention turns to the tone of the Federal Open Market Committee (FOMC) statement, and whether it is hawkish (expectant of higher future interest rates), or dovish (expectant of lower future rates).
Read more.Next release: Wed Jun 12, 2024 18:00
Frequency: Irregular
Consensus: 5.5%
Previous: 5.5%
Source: Federal Reserve


