


Amazon.com Inc Stock (AMZN) Opened Up by 5.67% on Nov 9: What Signal Does It Send?


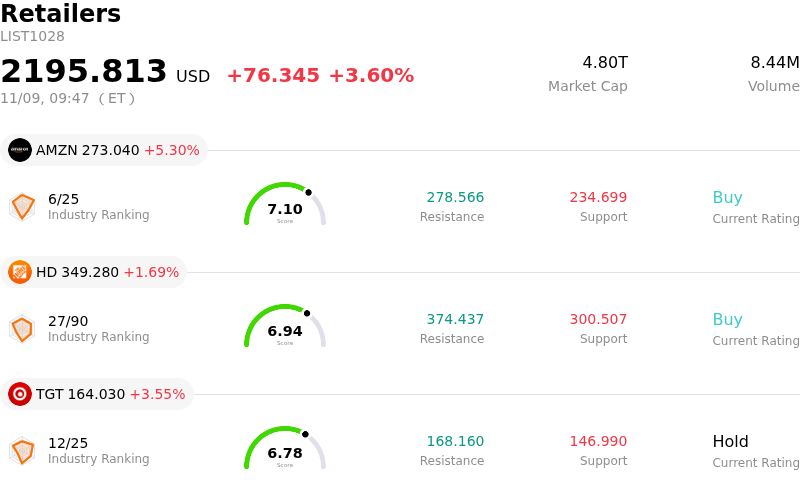
Amazon.com Inc (AMZN) opened up by 5.67%. The Retailers sector is up by 3.60%. The company outperformed the industry. Top 3 stocks by turnover in the sector: Amazon.com Inc (AMZN) up 5.67%; Home Depot Inc (HD) up 1.69%; Target Corp (TGT) up 3.55%.
What is driving Amazon.com Inc (AMZN)’s stock price up today?
Amazon shares experienced robust upward momentum during the session, driven by a confluence of accelerating enterprise cloud adoption, high-margin retail execution, and positive institutional positioning following recent corporate updates. Institutional investors increasingly view the tech giant as a primary beneficiary of durable corporate IT spending and monetization across generative artificial intelligence infrastructure.
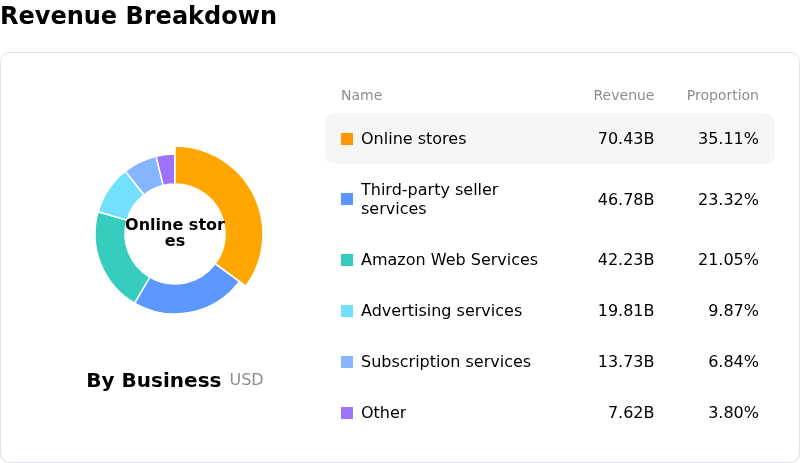
A primary catalyst for the rally is the strengthening operational profile of Amazon Web Services. Channel checks and recent cloud demand indicators point to a notable re-acceleration in cloud migrations, supported by the expanding deployment of proprietary silicon and generative AI workloads. Enterprise clients are expanding long-term committed spend, alleviating prior market concerns regarding capacity constraints and pricing pressure. As enterprise budget optimization cycles mature into active modernization and AI investment, AWS is capturing an outsized share of incremental cloud workloads, enhancing visibility into top-line acceleration and segment operating margins.
In the core e-commerce business, operational efficiencies continue to yield structural margin expansion. The ongoing refinement of Amazon regional fulfillment network has lowered the cost-to-serve while significantly improving delivery speeds. This optimized logistics footprint, combined with robust momentum in high-margin third-party seller services and digital advertising, is providing substantial operating leverage heading into the critical holiday shopping period. Advertisers continue to allocate greater budget share to Amazon high-intent retail media network and streaming inventory, reinforcing cash flow generation that mitigates broader consumer spending softness.
Broader macro and market dynamics also contributed to the advance. Favorable sentiment across mega-cap technology equities and stabilizing long-term yields provided a supportive liquidity backdrop for large-cap growth assets. Several sell-side investment firms reiterated positive ratings and raised medium-term price targets, pointing to sustained free cash flow compounding and disciplined capital expenditure returns. Institutional portfolio managers appear to be rotating capital into market leaders exhibiting clear operating leverage and defensive cash generation.
Looking ahead, while macroeconomic uncertainties and potential volatility in discretionary consumer spending remain key variables to monitor, Amazon multi-engine growth model across cloud infrastructure, high-margin advertising, and retail automation positions the company well for sustained multi-quarter earnings power. Investors will remain focused on sustained AWS growth trends, capital expenditure efficiency, and holiday quarter delivery volumes as key gauges of fundamental momentum.
Technical Analysis of Amazon.com Inc (AMZN)
Technically, Amazon.com Inc (AMZN) shows a MACD (12,26,9) value of 4.023, indicating a neutral signal. The RSI at 62.861 suggests neutral condition and the Williams %R at 0.727 suggests overbought condition. Please monitor closely.
Media Coverage of Amazon.com Inc (AMZN)
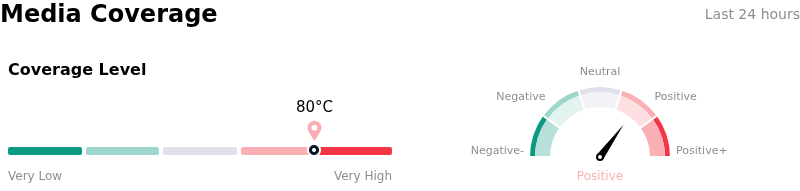
In terms of media coverage, Amazon.com Inc (AMZN) shows a coverage score of 80, indicating a high level of media attention. The overall market sentiment index is currently in bullish zone.
Fundamental Analysis of Amazon.com Inc (AMZN)
Amazon.com Inc (AMZN) is in the Retailers industry. Its latest annual revenue is $716.92B, ranking 1 in the industry. The net profit is $77.67B, ranking 1 in the industry. Company Profile
Over the past month, multiple analysts have rated the company as Buy, with an average price target of $323.05, a high of $405.00, and a low of $207.00.
More details about Amazon.com Inc (AMZN)
Company Specific Risks:
- Surging Capital Expenditures and Free Cash Flow Contraction: Intraday volatility has heightened following analyst scrutiny over aggressive artificial intelligence investments, which have driven trailing free cash flow down to negative $42.4 billion and required substantial debt financing to fund planned annual capital expenditures near $220 billion.
- Data Center Power Constraints and Deployment Bottlenecks: AWS faces operational bottlenecks due to regional grid capacity shortages and power delivery delays, leading to reports of high-performance compute clusters and specialized AI hardware sitting temporarily idle and delaying revenue realization.
- Regulatory Curbs on AI Data Center Expansion: Downside sentiment is pressured by recent political and regulatory developments indicating potential legislative restrictions, environmental zoning hurdles, and utility grid constraints on rapid hyperscale data center construction.
- Decelerating High-Margin Advertising Momentum: Recent quarterly data showed Amazon's slowest digital advertising revenue expansion since 2023, creating margin compression fears across the retail division as fourth-quarter holiday revenue guidance came in below top-tier Street expectations.
This article may include AI-generated content that is human-reviewed, which is for reference and general information purposes only and does not constitute investment advice.
Recommended Articles









Comments (0)
Click the $ button, enter the symbol, and select to link a stock, ETF, or other ticker.