NZD/JPY Price Analysis: Reversal pattern on the cards as indicators turn bullish

Fxstreet
Sep 17, 2024 9:37 PM
- The NZD/JPY pair's latest price action shows a reversal of last week's losses with the pair extending gains from Tuesday’s session.
- RSI is sharply rising, showing that buying pressure is recovering.
- Decreasing red bars in the MACD suggests that selling pressure is weakening.
In Tuesday's session, the NZD/JPY pair rose by 0.95% above 88.00. Considering the fresh gains and the latest technical outlook, a reversal of last week's losses is on the cards.
The Relative Strength Index (RSI) is currently at 45, which is still in negative area. However, the slope of the RSI is sharply rising, indicating that buying pressure is recovering. The Moving Average Convergence Divergence (MACD) is also red, but the histogram is decreasing, suggesting that selling pressure is declining. This mixed technical outlook suggests that the NZD/JPY pair may continue to consolidate in the short term after the latest sharp losses.
NZD/JPY daily chart
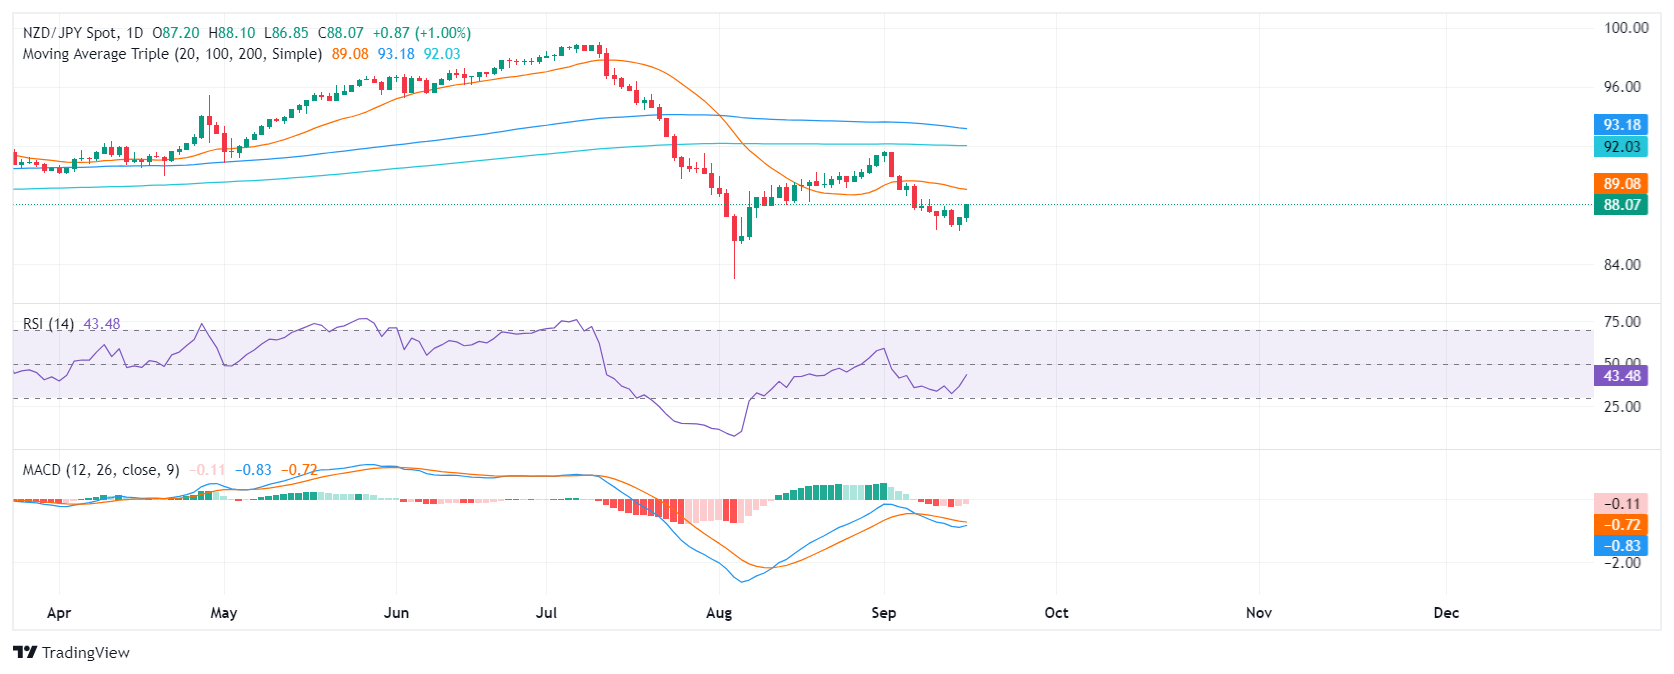
Supports to the downside are located at 86.50, 86.30, and 86.00, while resistances are seen at 87.50, 87.70, and 88.00. Traders should watch for a break above 88.50 or below 86.50 to confirm a breakout in either direction.
Related Articles
Trump leads Harris by 49% to 46%- CNN/SSRS poll
Investing.com-- Republican presidential nominee Donald Trump was seen leading Democratic frontrunner Kamala Harris in the 2024 presidential race, a CNN/SSR
Curve DAO Founder Michael Egorov faces liquidation
Curve DAO (CRV) price crashed 38% on Thursday. This market crash put Egorov's CRV positions on DeFi lenders into liquidation mode, according to data by Lo
Long-term investing framework: Are you a balanced bear? Goldman Sachs weighs in
Amidst market volatility and economic uncertainty, Goldman Sachs (NYSE:GS) has offered a fresh perspective with its "Strategic Balanced Bear" investing fra

