Gold Price Forecast: XAU/USD looks to test offers at $2,660 amid cautious optimism
Fxstreet
Nov 20, 2024 4:12 AM
- Gold price trades in the green for the third straight day on Wednesday, nears $2,650.
- Gold price gains on geopolitical risks and steady US Dollar even as Treasury bond yields recover.
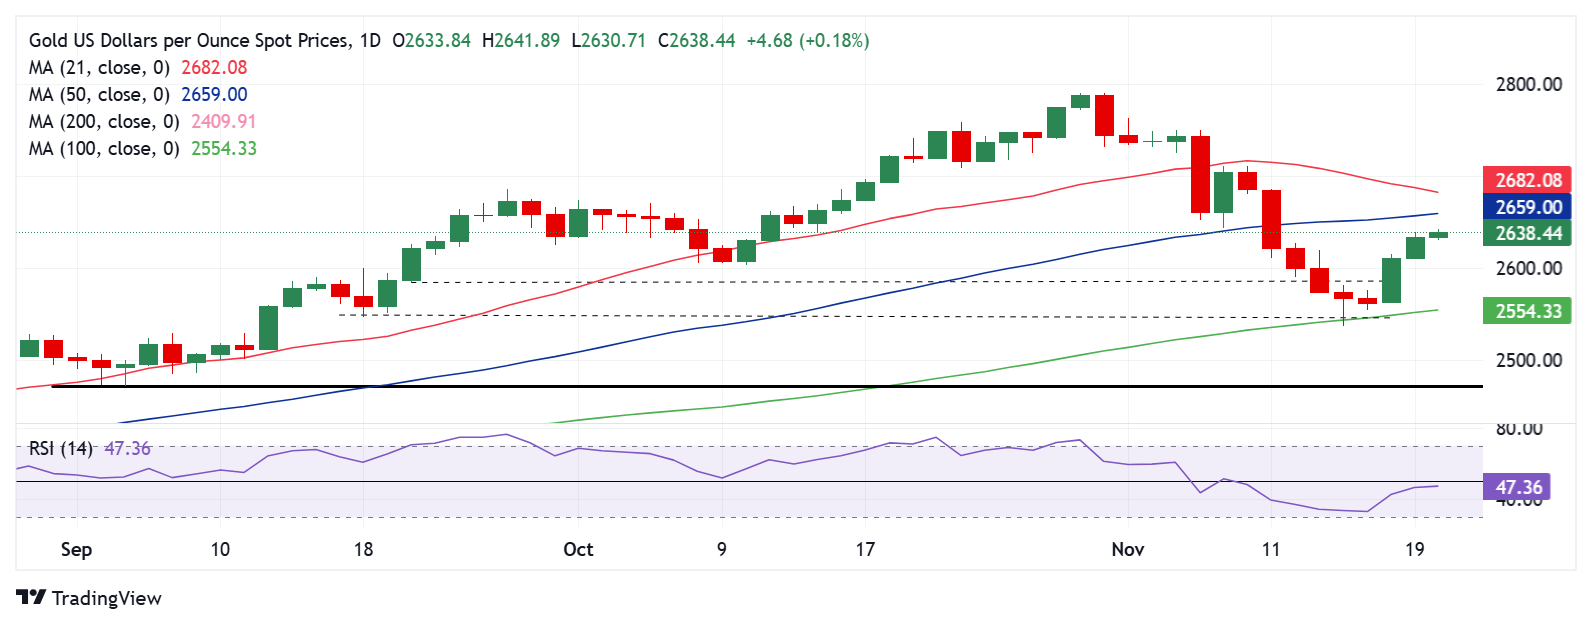
- Gold price closes on 50-day SMA resistance at $2,660 amid bearish daily RSI.
Gold price stays on the front foot early Wednesday, looking to regain the $2,650 barrier as the road to recovery extends for the third straight day. Traders now await the upcoming speeches from US Federal Reserve (Fed) policymakers and Nvidia’s earnings report amid lingering geopolitical concerns between Russia and Ukraine.
Gold price looks to geopolitics and Fedspeak for fresh directives
The US Dollar (USD) seems to find fresh demand in Asian trading on Wednesday, tracking the uptick in the US Treasury bond yields as broader market sentiment improves on China’s stimulus hopes.
Markets were cautious earlier following the People’s Bank of China’s (PBOC) inaction on the Loan Prime Rates (LPR). However, expectations that China will roll out more stimulus to prop up the economy are lifting the market mood.
Further, worries over a further geopolitical escalation between Russia and Ukraine seem to fade, lifting risk appetite.
However, Gold buyers refuse to give up so far, anticipating a shift in risk sentiment if the American AI giant Nvidia Inc.’s earnings report disappoints and triggers a wave of risk aversion across the financial markets.
Also, the developments surrounding Russia and Ukraine will be closely eyed, keeping the demand for the traditional safe-haven Gold price underpinned.
On Tuesday, Russia's Defence Ministry said that Ukraine fired six US-made Army Tactical Missile Systems (ATACMS) missiles at Bryansk region, just days after US President Joe Biden allowed the Ukrainian use of American-made weapons to strike inside Russia.
The Kremlin confirmed Tuesday that they lowered the threshold for a possible nuclear strike in response to non-nuclear attacks on Russia.
Besides, the Fedspeak will help gauge the US central bank’s path forward on interest rates, with markets now pricing in a 60% chance that the Fed will cut rates by 25 basis points (bps) in December.
Gold price technical analysis: Daily chart

The short-term technical outlook for Gold price remains the same, with traders likely to adopt a ‘sell on bounce’ trade strategy as the 14-day Relative Strength Index (RSI) remains below the 50 level. The indicator is currently trading near 47.
An impending Bear Cross adds credence to the downside potential. The 21-day Simple Moving Average (SMA) is looking to cross the 50-day SMA above. If that happens on a daily closing basis, it will validate the bearish crossover.
That said, failure to find acceptance above the 50-day SMA at $2,660 on a daily closing basis could reinforce sellers toward the $2,600 threshold.
The previous day’s low of $2,610 will be tested ahead of that.
On the flip side, the immediate resistance is seen at the 50-day SMA, above which the 21-day SMA at $2,682 will come into play.
Additional recovery could face stiff resistance at the $2,700 threshold.
Gold FAQs
Gold has played a key role in human’s history as it has been widely used as a store of value and medium of exchange. Currently, apart from its shine and usage for jewelry, the precious metal is widely seen as a safe-haven asset, meaning that it is considered a good investment during turbulent times. Gold is also widely seen as a hedge against inflation and against depreciating currencies as it doesn’t rely on any specific issuer or government.
Central banks are the biggest Gold holders. In their aim to support their currencies in turbulent times, central banks tend to diversify their reserves and buy Gold to improve the perceived strength of the economy and the currency. High Gold reserves can be a source of trust for a country’s solvency. Central banks added 1,136 tonnes of Gold worth around $70 billion to their reserves in 2022, according to data from the World Gold Council. This is the highest yearly purchase since records began. Central banks from emerging economies such as China, India and Turkey are quickly increasing their Gold reserves.
Gold has an inverse correlation with the US Dollar and US Treasuries, which are both major reserve and safe-haven assets. When the Dollar depreciates, Gold tends to rise, enabling investors and central banks to diversify their assets in turbulent times. Gold is also inversely correlated with risk assets. A rally in the stock market tends to weaken Gold price, while sell-offs in riskier markets tend to favor the precious metal.
The price can move due to a wide range of factors. Geopolitical instability or fears of a deep recession can quickly make Gold price escalate due to its safe-haven status. As a yield-less asset, Gold tends to rise with lower interest rates, while higher cost of money usually weighs down on the yellow metal. Still, most moves depend on how the US Dollar (USD) behaves as the asset is priced in dollars (XAU/USD). A strong Dollar tends to keep the price of Gold controlled, whereas a weaker Dollar is likely to push Gold prices up.
