USD/CAD Price Forecast: Hanging Man reversal candlestick might signal important pivot

Fxstreet
Sep 19, 2024 11:18 AM
- USD/CAD has formed a candlestick reversal pattern on the daily chart.
- This could mark an important reversal in the short-term trend.
USD/CAD is falling on Thursday, trading almost half a percentage point lower on the day, and forming a long red candlestick (see chart below).
USD/CAD Daily Chart
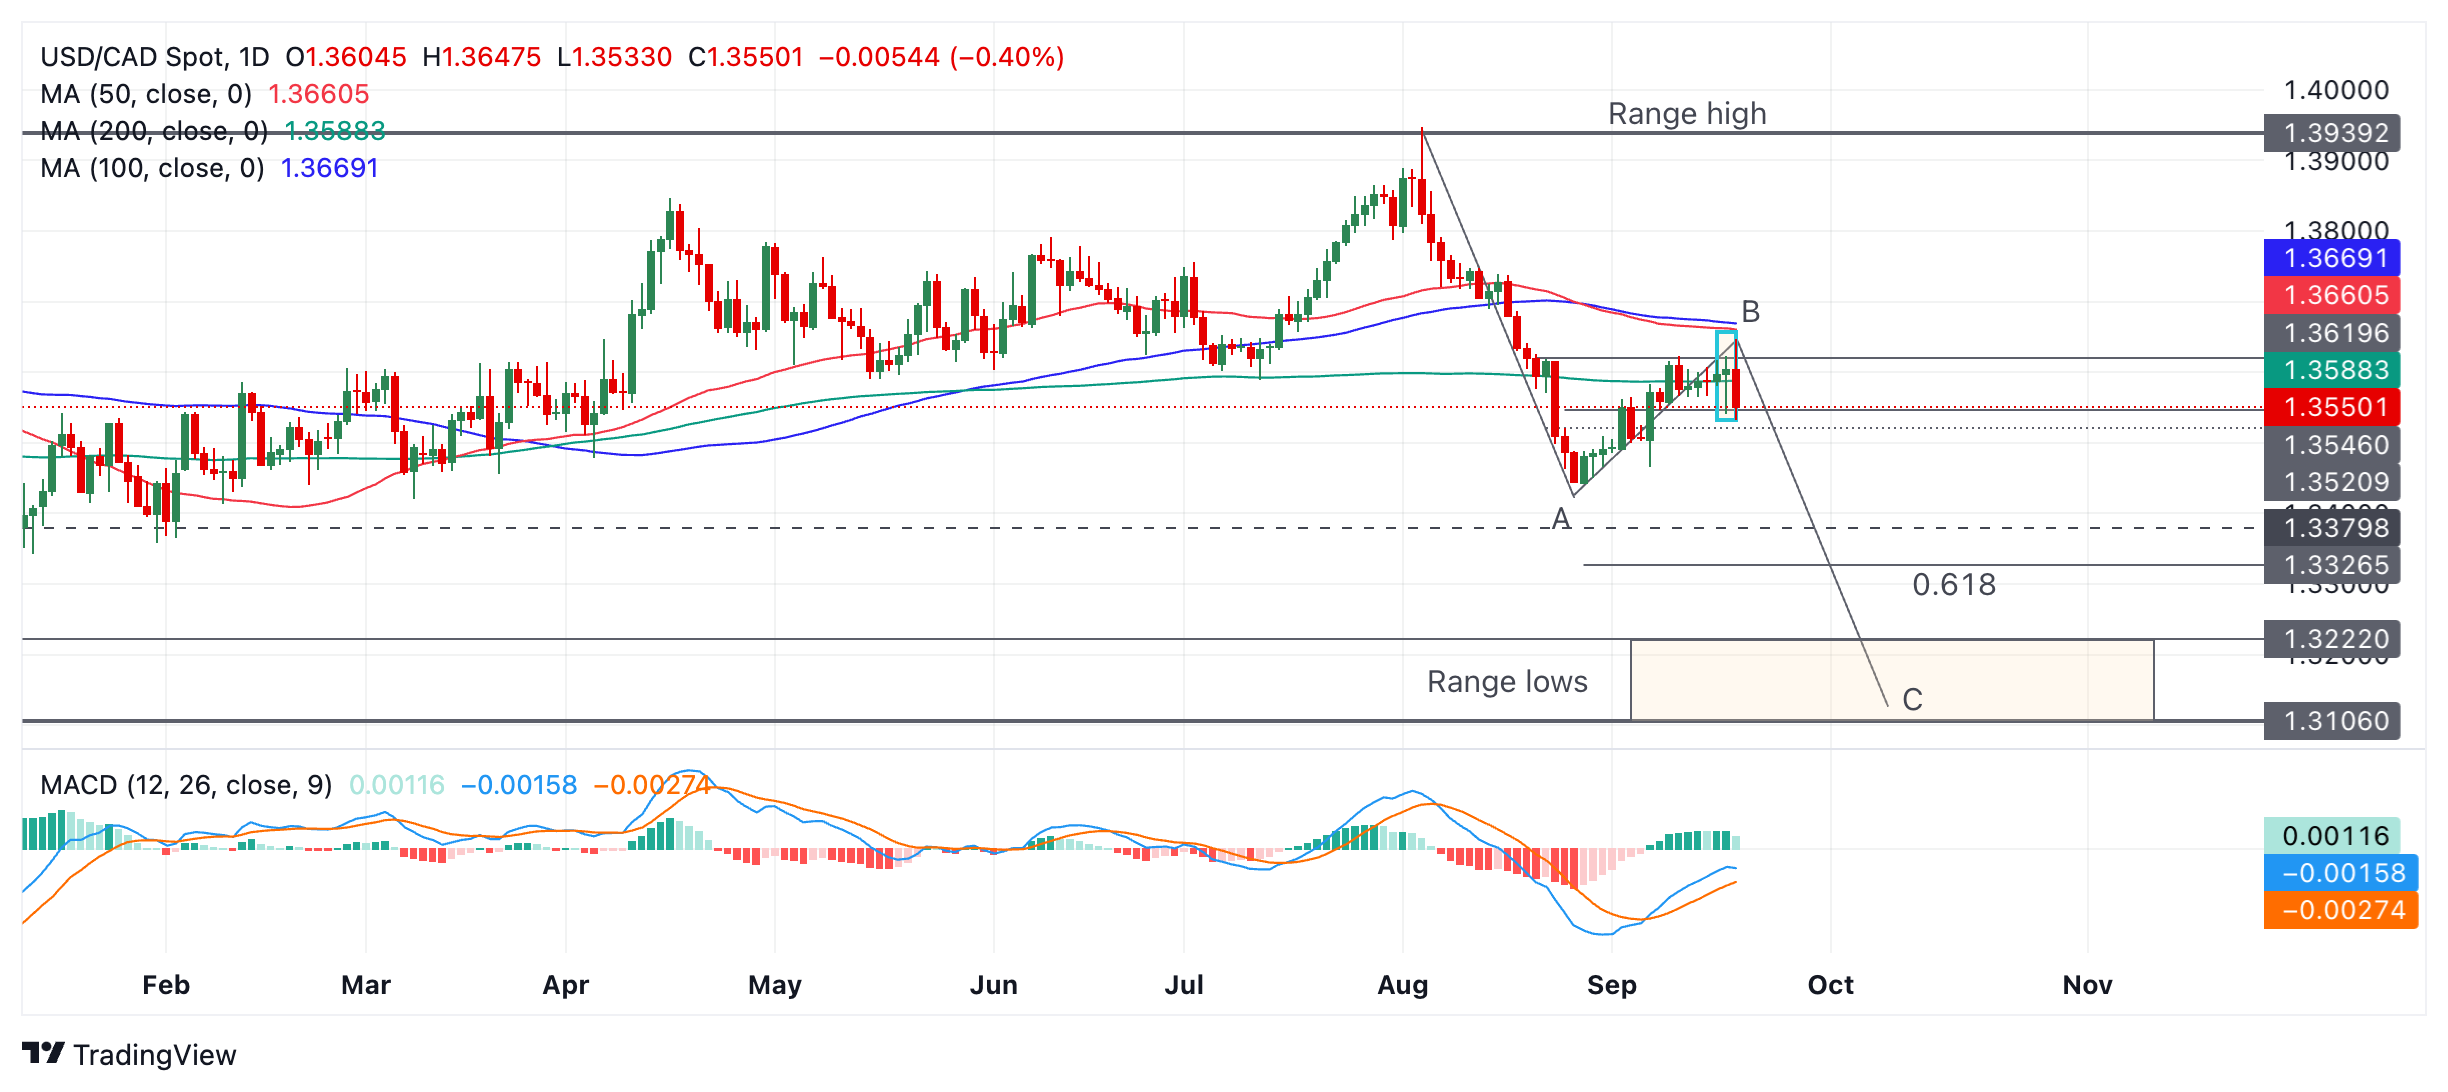
On Wednesday USD/CAD formed a bearish Hanging Man Japanese candlestick pattern (blue rectangle on chart above). This pattern forms when price rises to a new high, pulls back down during the same day, then recovers again and closes the day just below where it opened. If it is followed by a red down day, a short-term bearish reversal is confirmed.
Thursday’s red down day so far appears to be confirming the Hanging Man. It may be highlighting a pivot point, or reversal of the rally that began at the August 28 low.
USD/CAD is oscillating within a larger range and the overall structure of the move down from the range high appears to conform to that of an ABC pattern, or “Measured Move”. These patterns are like large zig-zags with wave C usually reaching a similar length to wave A. If USD/CAD really is forming an ABC pattern then C should end within the zone of the range lows (orange shaded rectangle on chart above).
It is also possible the move could reach a point where wave C is a Fibonacci 0.618 ratio of the length of wave A. If so it would probably reach 1.3326.
If Thursday ends as a bearish down day it will provide confirmation of an extension lower towards the aforesaid targets. A break below 1.3466 (September 6 low) would provide additional bearish confirmation.
Related Articles
Trump leads Harris by 49% to 46%- CNN/SSRS poll
Investing.com-- Republican presidential nominee Donald Trump was seen leading Democratic frontrunner Kamala Harris in the 2024 presidential race, a CNN/SSR
Long-term investing framework: Are you a balanced bear? Goldman Sachs weighs in
Amidst market volatility and economic uncertainty, Goldman Sachs (NYSE:GS) has offered a fresh perspective with its "Strategic Balanced Bear" investing fra
Curve DAO Founder Michael Egorov faces liquidation
Curve DAO (CRV) price crashed 38% on Thursday. This market crash put Egorov's CRV positions on DeFi lenders into liquidation mode, according to data by Lo

