EUR/CAD Price Analysis: Probably completing a large Symmetrical Triangle

Fxstreet
Jun 25, 2024 1:31 PM
- EUR/CAD is completing a Symmetrical Triangle pattern on the weekly chart.
- A breakout is expected – probably quite soon – leading to a volatile directional move higher or lower.
- Given the move prior to the pattern in 2022-23 was bullish, the odds marginally favor a breakout and continuation higher.
EUR/CAD is completing a Symmetrical Triangle pattern on the weekly price chart, which indicates the pair is poised to break out and move in a volatile directional fashion.
EUR/CAD Weekly Chart
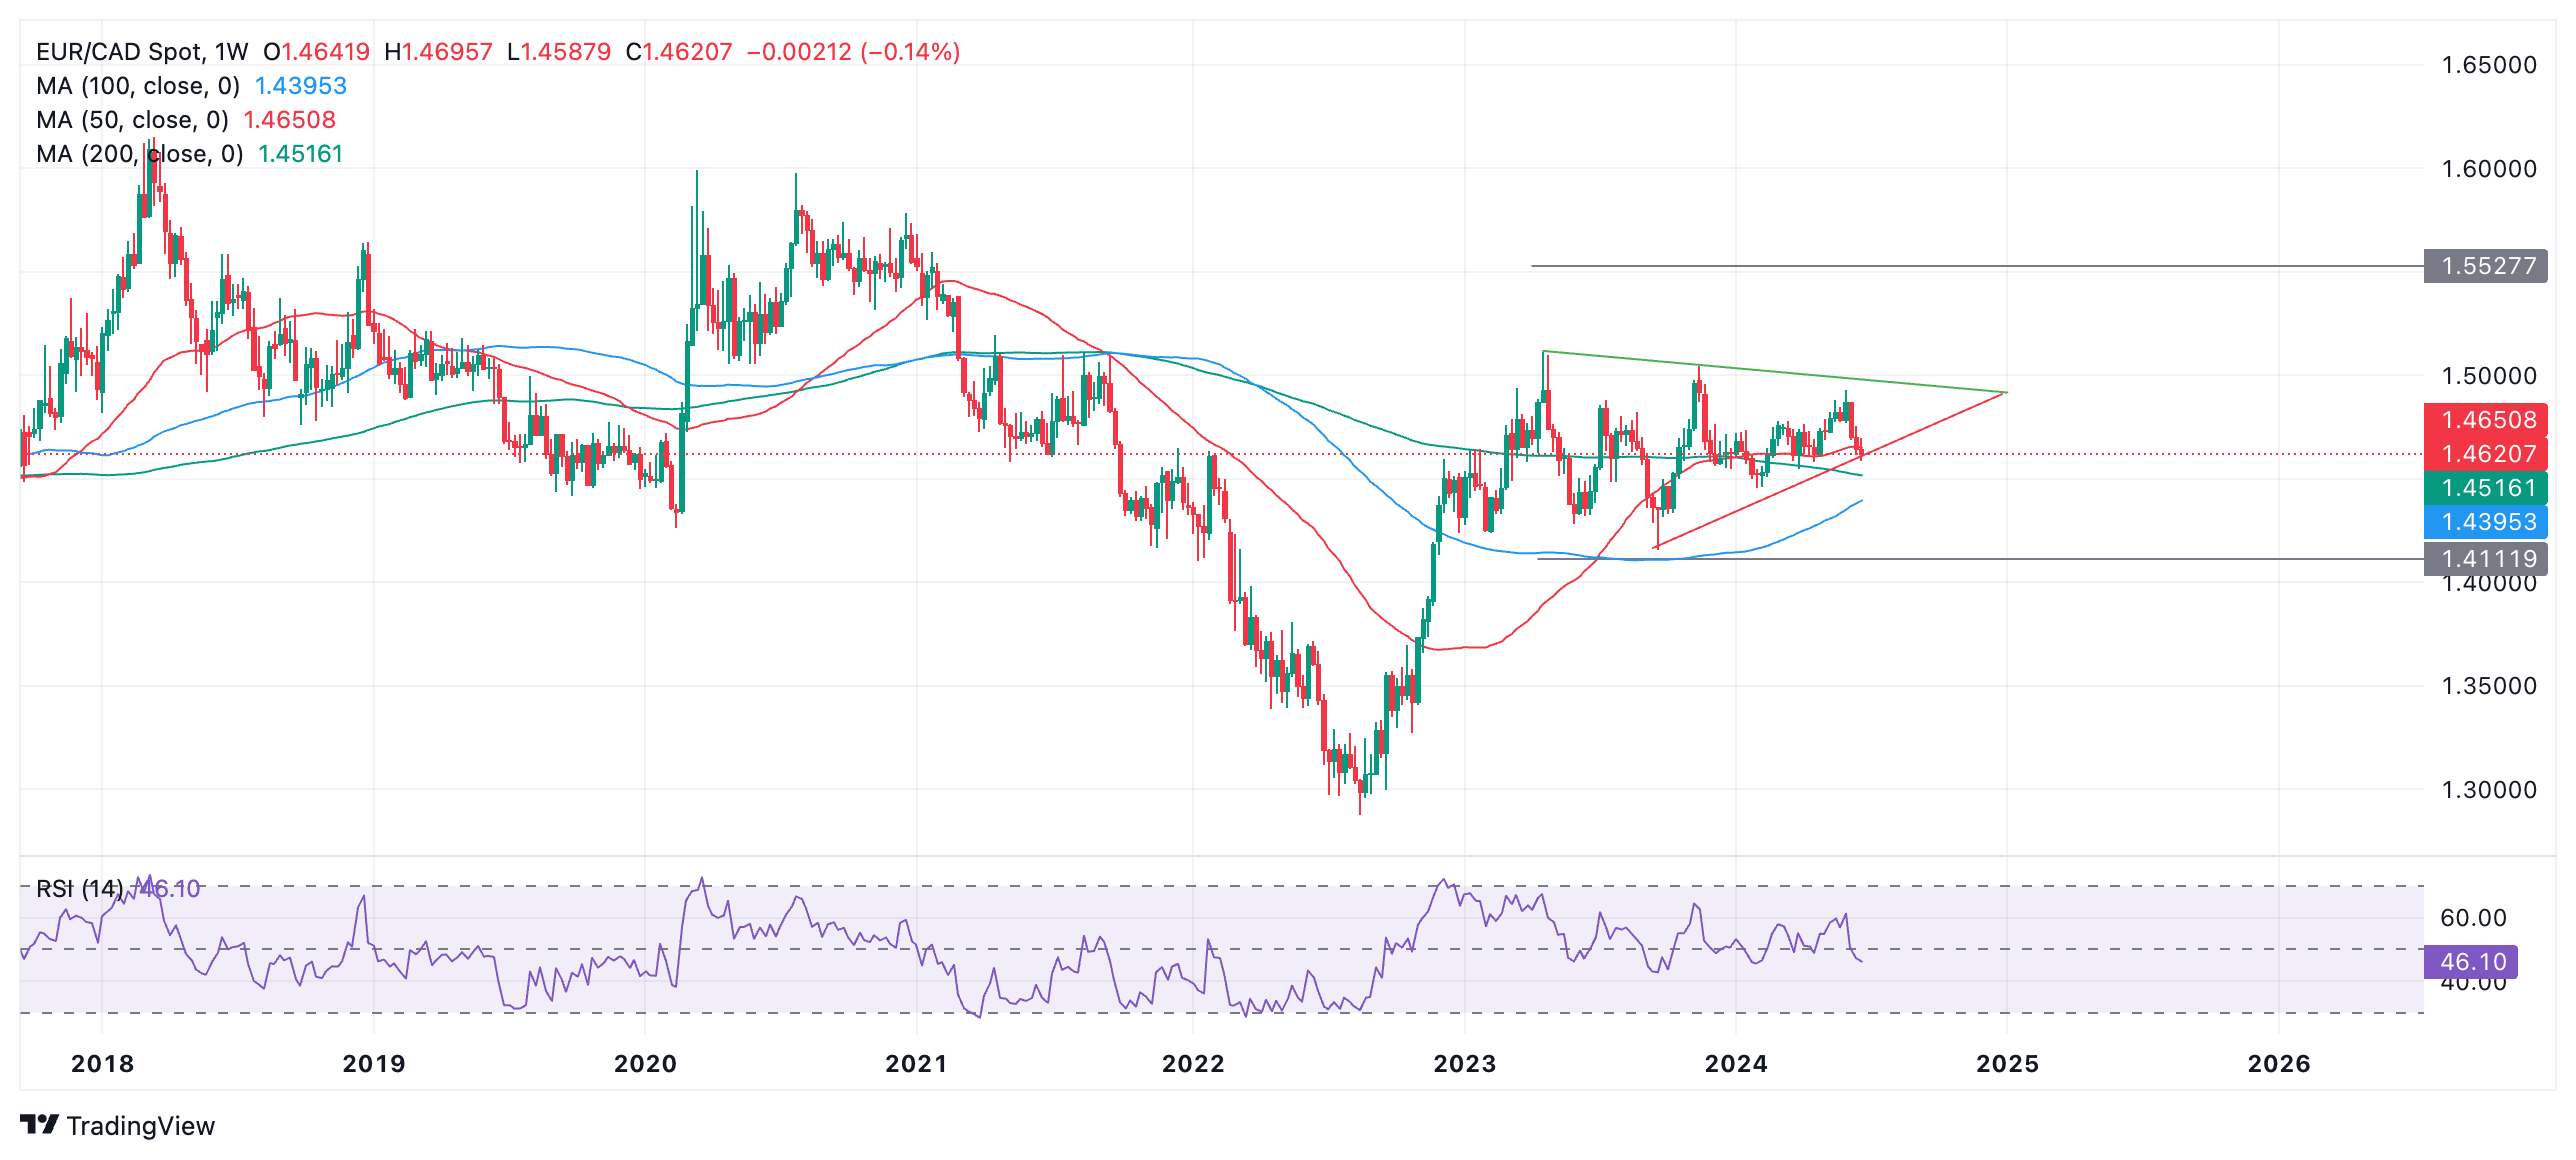
The bigger picture for EUR/CAD is that the pair bottomed out in 2022 and recovered. From the start of 2023 the pair started consolidating and began forming a Symmetrical Triangle pattern.
The Symmetrical Triangle (ST) pattern has formed roughly five internal waves which is the minimum for reaching completion. It is possible that it has finished, therefore, and could break out quite soon.
A breakout higher is marginally more likely than a breakout lower because the move prior to the formation of the ST was bullish. It could also be argued that the pair began a long-term uptrend prior to the formation of the ST.
A decisive break above the upper (green) boundary line would be indicative of an upside breakout. This would be expected to reach a target at roughly 1.5528, the 0.618 Fibonacci of the height of the ST at its widest point extrapolated higher from the breakout point.
Likewise, the same goes for a decisive break lower, only with a target at roughly 1.4112.
A decisive break higher would be defined as a breakout that was accompanied by a long, green, weekly candle that closes near its high, or three candles in a row that break higher. In the case of a breakout lower the same would apply only with a red candle instead.
Related Articles
Trump leads Harris by 49% to 46%- CNN/SSRS poll
Investing.com-- Republican presidential nominee Donald Trump was seen leading Democratic frontrunner Kamala Harris in the 2024 presidential race, a CNN/SSR
Long-term investing framework: Are you a balanced bear? Goldman Sachs weighs in
Amidst market volatility and economic uncertainty, Goldman Sachs (NYSE:GS) has offered a fresh perspective with its "Strategic Balanced Bear" investing fra
Curve DAO Founder Michael Egorov faces liquidation
Curve DAO (CRV) price crashed 38% on Thursday. This market crash put Egorov's CRV positions on DeFi lenders into liquidation mode, according to data by Lo

