Where the market is heading after dovish Powell at Jackson Hole


While Powell said nothing about how much rate they are going to cut, the market has a reason to celebrate as we have seen the implied rate from 30 days’ Federal Fund Futures for Dec 2024 came down to about 4.5% indicating a 100% possibility of more than three 25 bps cuts before the end of 2024.
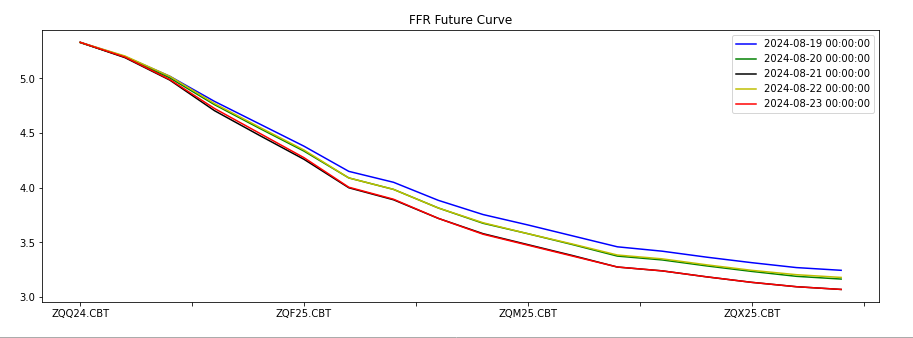
Data source: Yahoo
At the same time, 10 years’ treasury yields declined slightly from 3.86% to 3.81%.
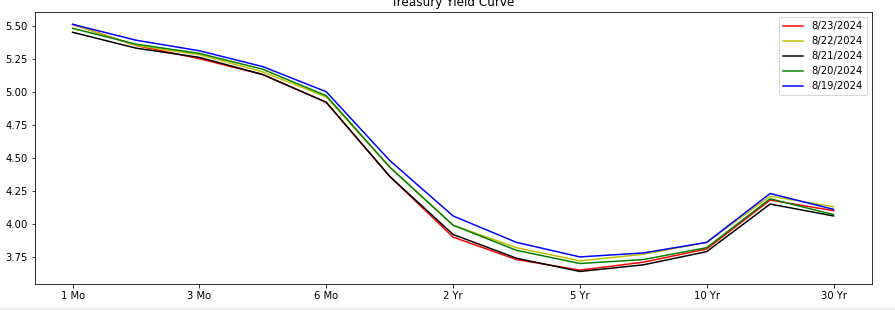
Data source: Yahoo
As the 2024 US election approaches, we have no doubt about the certainty of a September rate cut in terms of the whole economic and political dynamics and, now, the deal is done after the Jackson hole. The recent significant correction of non-farm payroll number also sits on the side of Powell to encourage him to deliver a nice smile to White House.
Obviously, the equity market likes it most because of benefit from the valuation.
It is particularly true for the small size companies with high multiples since they have been suffering from their deteriorating cash flows and the renewals of their debts with much higher costs.
However, before we know where the US equity market is heading we must give a few of shots on how the change in FFR influences the 10 years’ treasury yield, how the slowing down of economy hurts companies’ earnings, and how the shrinking MMF’s return impacts investors’ tolerance to risky assets.
As one of our ML-based non-regression models indicates, for every 100 bps cut in FFR, there will be a decrease of no more than 26 bps in 10 years’ T yield, which means the valuation’s impact of rate cut on equity is limited unless the Fed comes to public market to buy treasury again. However, since the #1 priority of US policy is still a strong US dollar, doing so will probably destroy US dollars’ absolute value in the circumstance where US deficits are swelling and oversea buyers are retreating simultaneously. Therefore, 50 bps drop in 10Y T yield is not a conservative estimate at this moment given no severe recession.
However, a recession at this time, unlike in 2020, will be very likely to create a divergence between earnings growth and valuation, which will be unfavorable to equity market, since, for this time, the Fed cannot cut the rate to zero and drag down 10Y T yield to somewhere below 2% again.
Tracing S&P 500 earnings, we found that the economy may be losing fuel in the past quarter from its recent peak in Q1 2024 while the retail sales number of July gave us a relief.
In fact, in the whole earnings season of Q2 2024, the market has been playing a logic of recession as we can see that the S&P500 dropped down to the bottom on 20240802, as a result of index earnings growth (released) down to the bottom, and then rebounded as the earnings growth made a turn, thanks to the relatively smaller companies’ excellent financial performance.
In Q2 2024, S&P 500 EBIT grew at about 1.1% instead of 2.4% in Q1 2024 (QoQ). A recession will apparently speed up this deceleration and even cause significant decrease in earnings, which will offset the benefit from valuation as a result of 50 bps down in 10Y T yield.
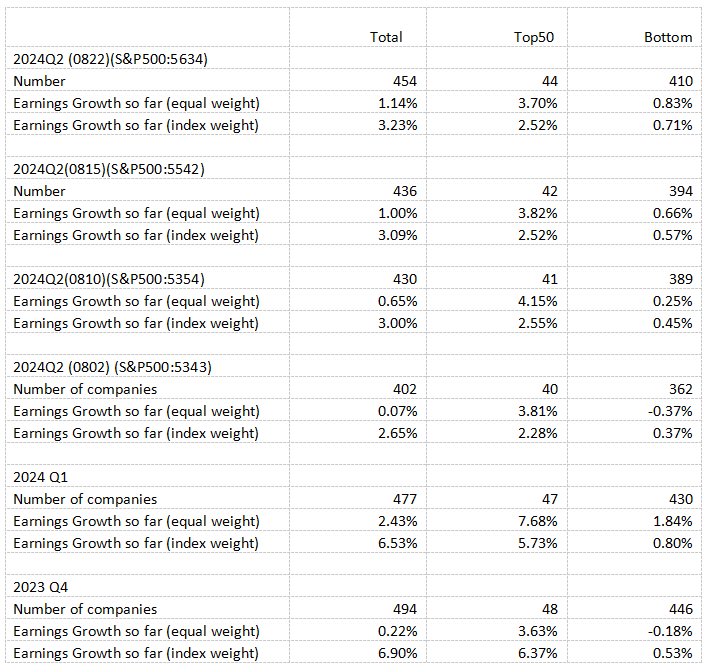
Data source: Bloomberg
The current S&P 500 represents an EPS (weighted) of 226 and as high as PE of 27. The 20 of 27 can be partially explained by around 2-2.5% growth in both real GDP growth and inflation in the next few years with current treasury yields plus a 5% spread. The 4 of 27 can be explained by less spread or shrinking treasury yields.
Therefore, there is still 3 of 27, which is equal to about 11% of 5600 (S&P500 price), that has to be explained by higher earnings growth of S&P 500 companies than economy growth. And the possible reasons for this higher rate usually come from either less labor expenses or from the overweight, of the distribution of income in the whole economy, on companies with big market caps, probably a result of uneven distribution of pricing power among companies.
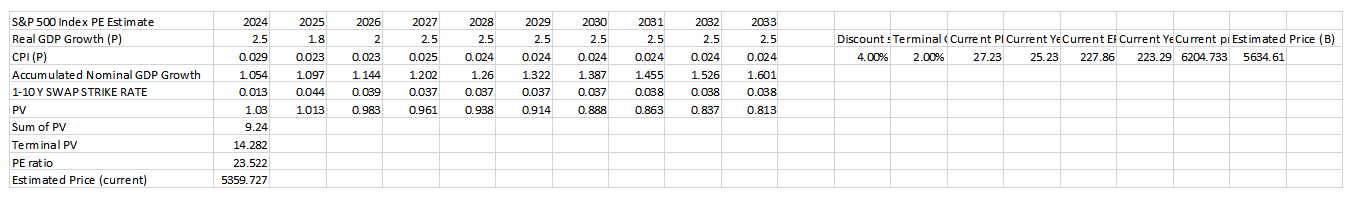
Data source: Bloomberg
In summary, if the factors mentioned above cannot justify current S&P500 PE of 27, we may be seeing bubbles in the market because 1. the market may have priced in too much drop in 10Y T yields or in risk spread; 2. big guys may easily lose their growth engine - pricing power in a weak economy; 3. lifting earnings growth by cutting labors is not sustainable in a long run.
It is also certainly possible that we can see the following scenario: the coming September rate cut can help keep S&P500 EPS constantly staying above current 226 and even going up and, at the same time, fund rushing out of MMF and ON RRP and into big tech to put down risk spread of these stocks and thus the weighted average spread of S&P500 as we can see, from the table below, that more than $83B continued to be out from ON RRP and US TGA accounts and go into bank reserves in the past month.
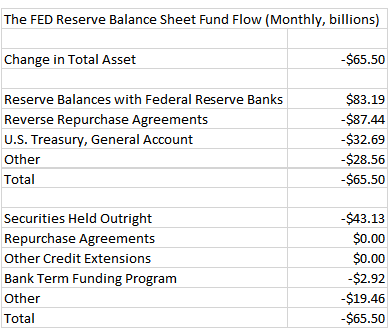
Data source: Fred