GBP/USD churns below 1.2900 ahead of BoE rate call


- GBP/USD is cycling chart paper just south of 1.2900.
- Fed rate call in the books, expected BoE rate cut on the cards.
- BoE expected to vote 5-to-4 in favor of a quarter-point rate cut.
GBP/USD waffled in a near-term range on Wednesday after the Federal Reserve (Fed) hit wide market expectations of one last rate hold for July, with expectations of a September Fed rate cut fully priced in, key data pending. The Bank of England (BoE) is expected to deliver a rate cut for the first time since March of 2020, but odds-makers are expecting a close 5-to-4 vote from the BoE’s Monetary Policy Committee (MPC).
Forex Today: Will the BoE dare?
Fed Chairman Jerome Powell laid out exactly what the Fed needs to see in order to deliver a rate cut in September, namely continued easing in inflation figures and US labor markets to either remain where they are or soften further, giving markets a hard target on upcoming key US data releases. US Nonfarm Payrolls looms ahead on Friday, and is expected to deliver on at least one item on the Fed’s wishlist as net job additions in July are expected to ease further.
The BoE is broadly expected to deliver a quarter-point rate trim on Thursday, but there’s still plenty of room for disappointment as median market forecasts expect the MPC to vote in favor of a rate cut 5-to-4. The MPC’s previous rate vote saw the UK’s policymakers agree to hold rates steady in a 7-to-2 split.
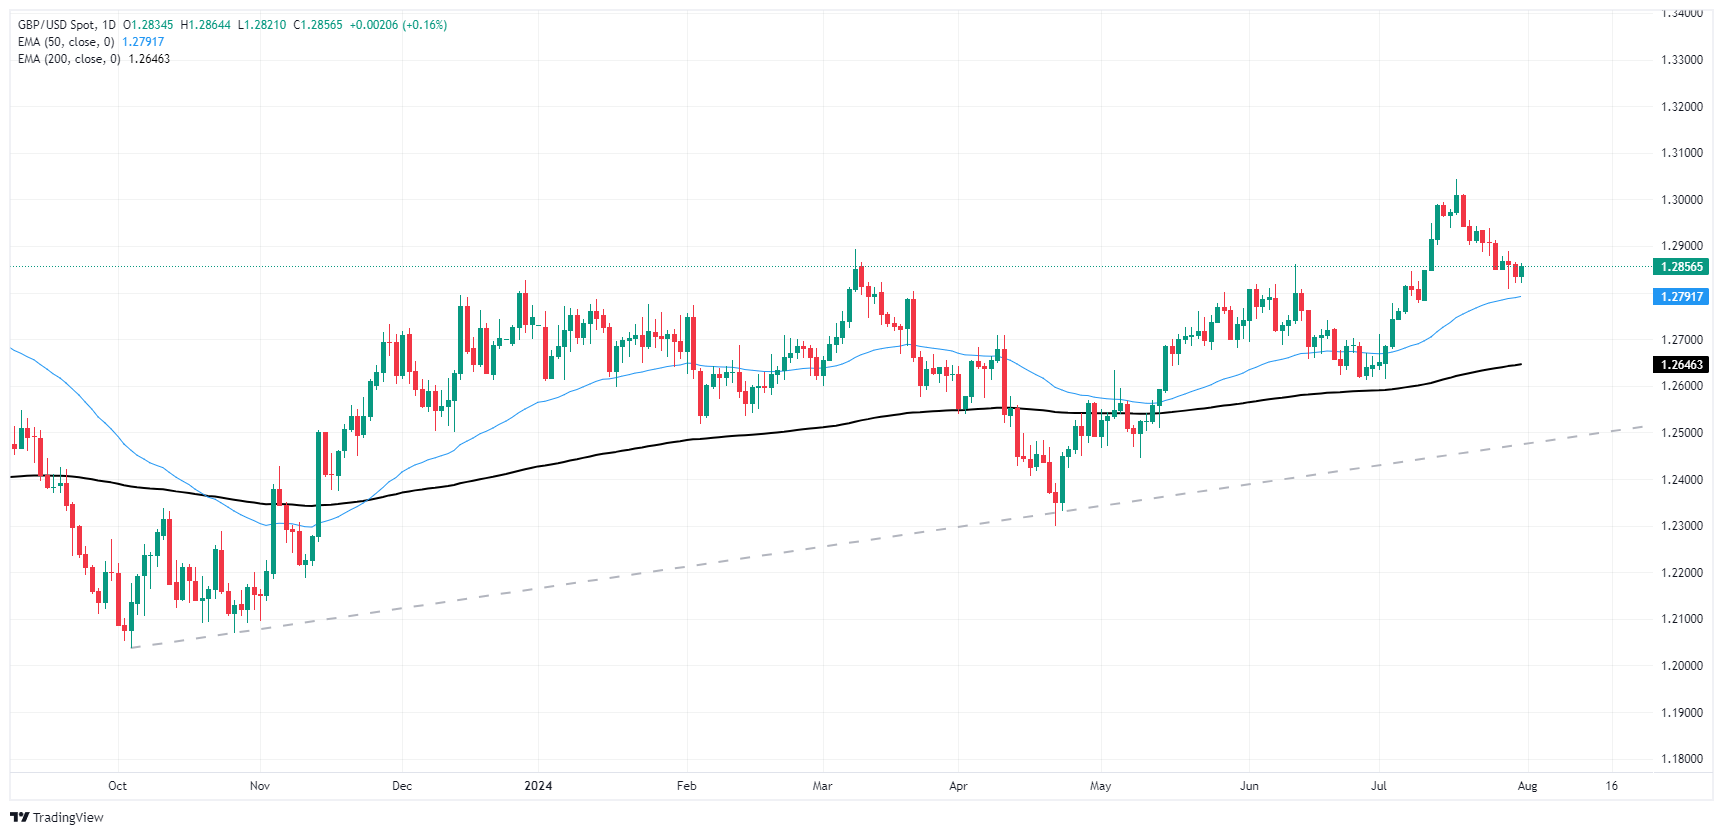
GBP/USD technical outlook
GBP/USD is struggling to find bullish momentum after the pair eased back below the 1.2900 handle after an extended backslide from 12-month highs near 1.3045 in recent weeks. Cable is still trading north of the 50-day Exponential Moving Average (EMA) at 1.2791.
The long-term trend in daily candlesticks is notably bullish with GBP/USD grinding out chart paper north of the 200-day EMA at 1.2642, and bidders will be looking for a pattern of higher lows help to bolster Cable back into a leg higher as long as the most recent pullback doesn’t drop below the last swing low just north of 1.2600.
GBP/USD daily chart