AUD/JPY Price Analysis: Cross plunges and falls below 108.00


- AUD/JPY sharply declined by more than 1.50%.
- The RSI fell non-stop from the deep overbought region near its middle point.
During Thursday's trading session, the AUD/JPY pair witnessed sharp losses towards 107.30. Overall, the pair is generally taking a pause as buyers hold off, and given the pair's status in the multi-year, the probability of further corrections is imminent. However, indicators scaped overbought conditions which is healthy for the pair.
On the daily view, the Relative Strength Index (RSI) for AUDJPY plunged to nearly 56, non-stop from the 70 threshold. Concurrently, the Moving Average Convergence Divergence (MACD) portrays a declining green bars scenario, mimicking a tapering off of the existing bullish momentum.
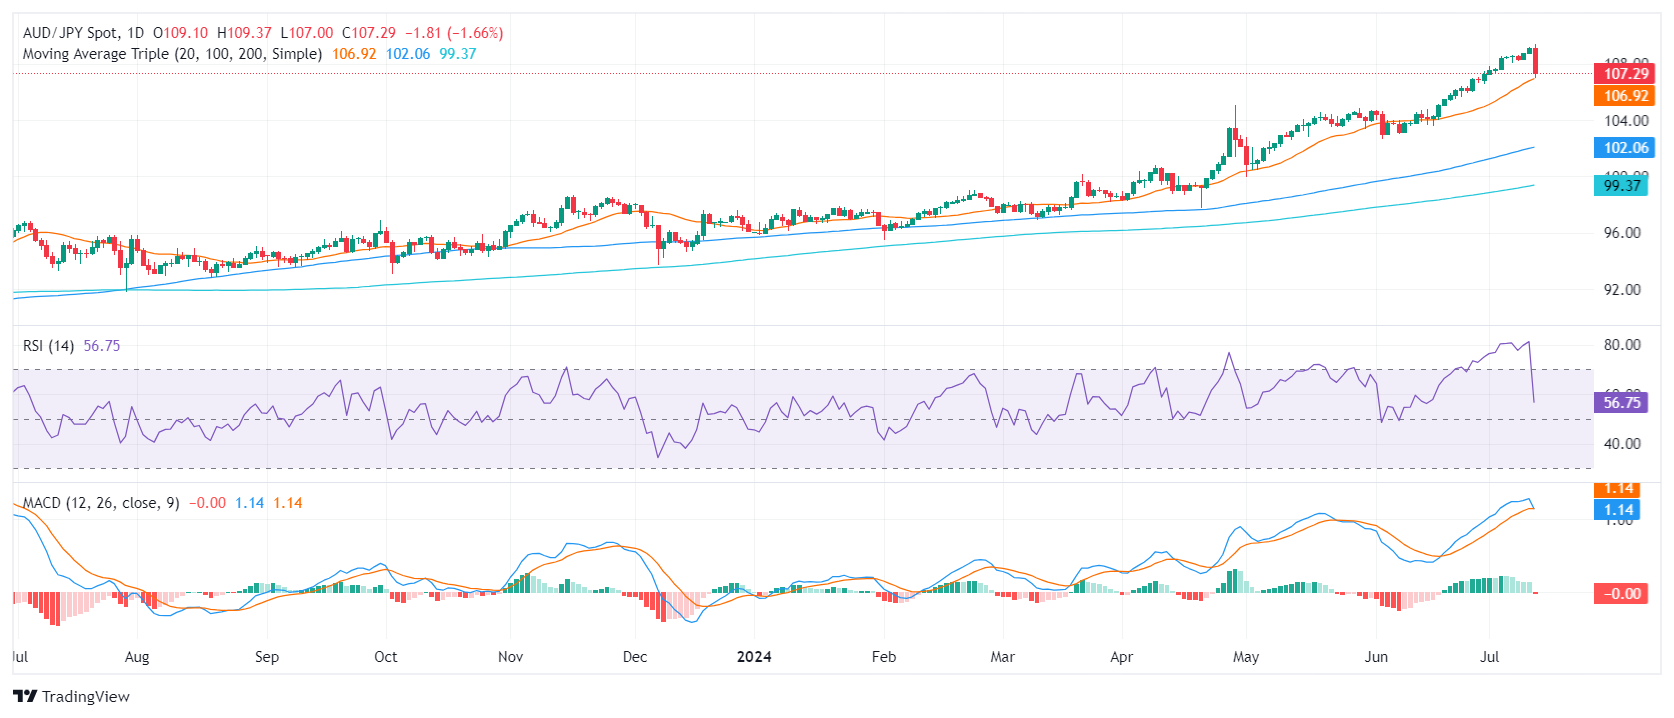
AUD/JPY daily chart
From the broader perspective, the AUD/JPY pair continues to exhibit signs of a potent bullish sentiment backed by its position in multi-year highs and above its main Simple Moving Averages (SMAs). In case of further pullbacks, several key supports line up below 107.00 where the 20-day SMA converges. The 106.50 and 106.00 could come into play to limit losses. However, should the pair sustain buyer interest, the pair might seek a retest around the 107.00-109.00 area.