EUR/USD Price Analysis: Remains above 1.0800, upper boundary of the descending channel


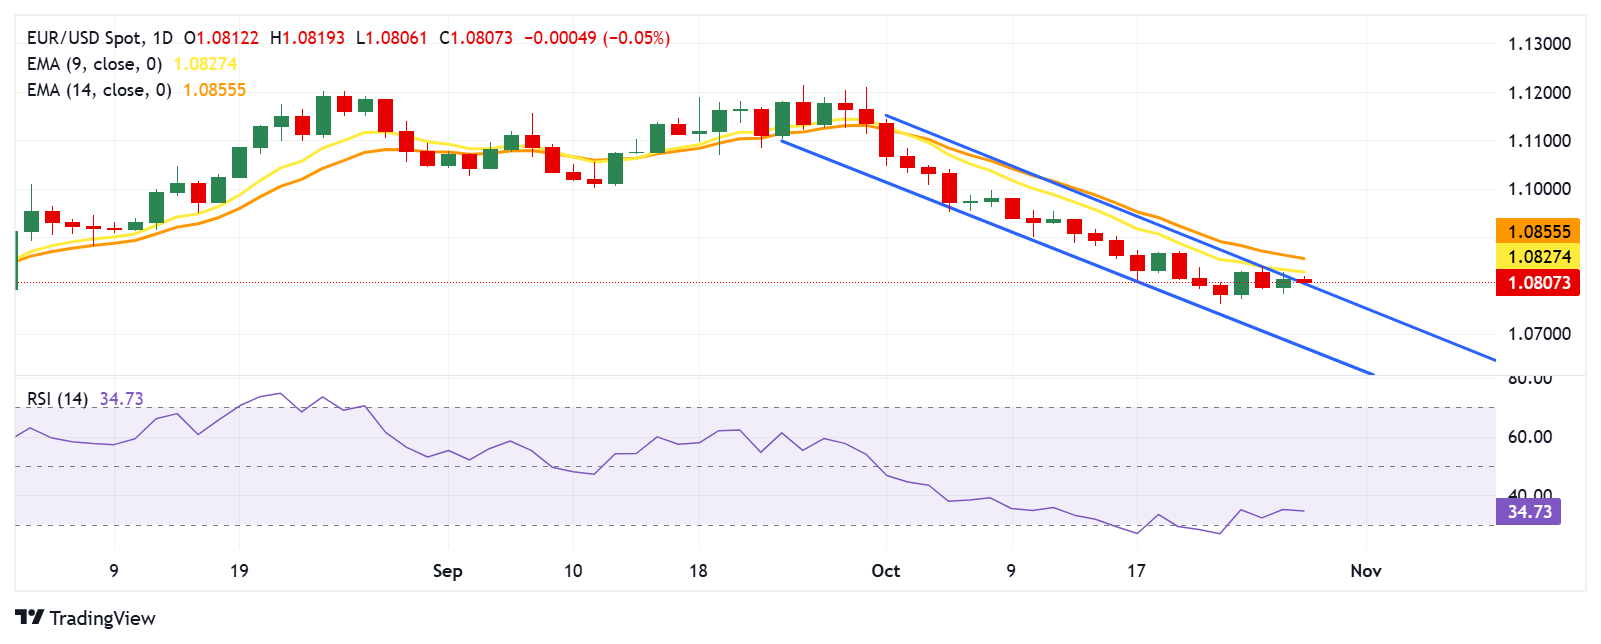
- EUR/USD may return to the descending channel pattern as bearish bias is still in play.
- The nine-day Exponential Moving Average (EMA) is below the 14-day EMA, suggesting an ongoing bearish bias for the pair.
- The pair finds support at a psychological level of 1.0800, aligned with the upper boundary of the descending channel.
EUR/USD retraces its recent gains from the previous session, trading around 1.0810 during the Asian hours on Tuesday. A review of the daily chart shows that the pair tests the upper boundary to return to the descending channel pattern. which could reinforce a bearish bias for the pair.
The 14-day Relative Strength Index (RSI), a key momentum indicator, is slightly above the 30 level. A drop below this threshold would indicate an oversold condition, suggesting the possibility of an upward correction for the EUR/USD pair in the near future.
Additionally, the nine-day Exponential Moving Average (EMA) is below the 14-day EMA, confirming the prevailing bearish trend in the EUR/USD pair’s price. The short-term price momentum is weaker, which could mean that the price is likely to continue experiencing downward pressure.
On the downside, the immediate support level appears to be at a psychological level of 1.0800, which coincides with the upper boundary of the descending channel. If the price falls back within this channel, it could increase the likelihood of a decline toward the psychological level of 1.0600.
A break below the 1.0600 level would likely heighten selling pressure, pushing the EUR/USD pair further down to test the lower boundary of the descending channel, estimated at around 1.0680.
In terms of resistance, the EUR/USD pair may encounter an immediate barrier around the nine-day Exponential Moving Average (EMA) at the 1.0826 level, followed by the 14-day EMA at the 1.0855 level. A breakthrough above these EMAs could lead the pair to approach the psychological level of 1.0900.
EUR/USD: Daily Chart


