Natural Gas snaps two-day rally after Ukraine enters Russia

- Natural Gas eases near 1% on Thursday after a stellar 8% surge earlier in the week.
- Some profit-taking took place after headlines emerged that Ukraine forces entered Russia.
- The US Dollar index eases after a two-day recovery.
Natural Gas price (XNG/USD) eases on Thursday after a steep surge that exceeded 8% gains over Tuesday and Wednesday. The surge came on the back of headlines that Ukrainian forces crossed the Russian border and were targeting Russian installations in the Kursk region. The risk that Russia would further limit or fully cut off the Gas supply towards Europe on the back of that news got priced in as of Tuesday.
Meanwhile, the US Dollar Index (DXY), which tracks the Greenback’s value against six major currencies, is easing as well after Dollar bulls were unable to push it above an important level. The risk now is that this technical rejection might result in more downturns for the US Dollar (USD). The weekly US Jobless Claims data on Thursday will be the main economic event for this week, and there might be a surge in volatility.
Natural Gas is trading at $2.15 per MMBtu at the time of writing.
Natural Gas news and market movers: Geopolitics ahead of EIA
- At 14:30 GMT, the weekly Natural Gas Storage Change data for the week ending August 2 will be released by the Energy Information Administration (EIA). The expectation is for a build from 18 billion to 22 billion metric tons of Natural Gas.
- The Kursk region is very gas-sensitive and holds a key Gas intake point. This might be one of the reasons why Ukraine decided to have an excursion into Russia in that specific region, according to Bloomberg.
- Temperatures are starting to ease in Egypt, which means the country's massive energy demand could end in the coming weeks.
- Bloomberg forecasts that demand for Natural Gas is set to fall further, with European storage at solid levels for the next heating season and Asian demand starting to fall month over month.
Natural Gas Technical Analysis: Dead cat bounce ahead?
Natural Gas price might has had a nice two-day recovery, but that could be bad for Gas prices in the long run. With that brief relief rally, the Relative Strength Index (RSI) has been able to move away from being oversold in the daily chart, which means there is room now again for another leg lower. Although the $2.15 level might have been reclaimed, pressure will grow for it to snap again.
Should more bullish headlines emerge and pull Gas price higher, look ahead for moving averages as upside resistances. First, the 100-day Simple Moving Average (SMA) and the 200-day SMA near $2.35. That would already be a significant move higher, and would definitely end the losing streak from recent weeks. Further up, the 55-day SMA at $2.51 could be tested.
On the downside, pressure is building on $2.13 to a breakdown again after the brief peak above it. In case that level snaps, $2.00 comes back into play for a test and possible dip below. Although still far away, a return sub-$2.00 could mean a longer-term downward trend, with $1.53 in the cards.
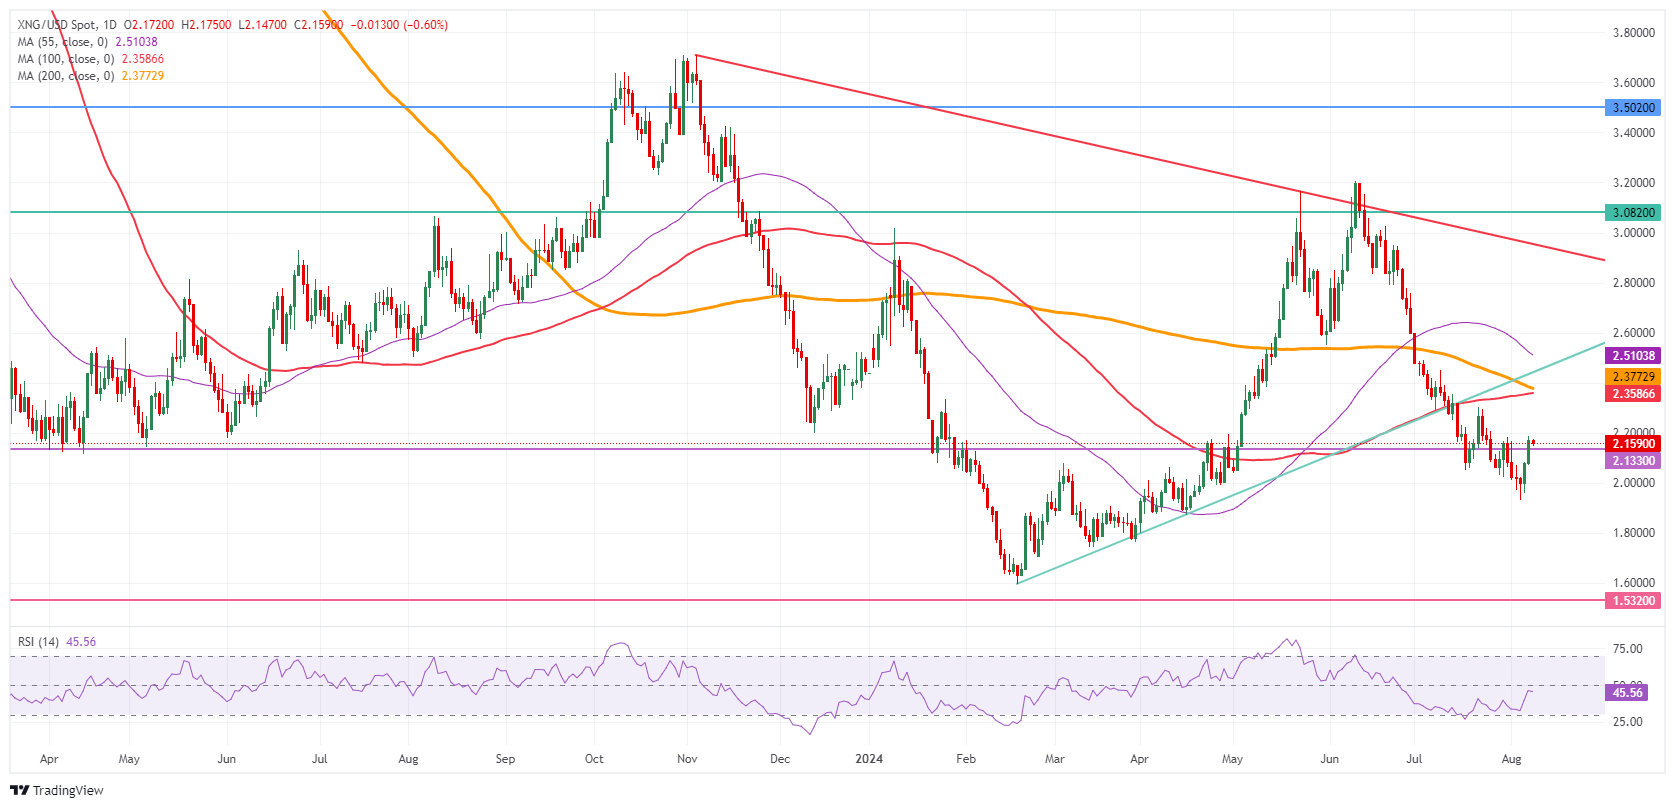
Natural Gas: Daily Chart
Natural Gas FAQs
What fundamental factors drive the price of Natural Gas?
Supply and demand dynamics are a key factor influencing Natural Gas prices, and are themselves influenced by global economic growth, industrial activity, population growth, production levels, and inventories. The weather impacts Natural Gas prices because more Gas is used during cold winters and hot summers for heating and cooling. Competition from other energy sources impacts prices as consumers may switch to cheaper sources. Geopolitical events are factors as exemplified by the war in Ukraine. Government policies relating to extraction, transportation, and environmental issues also impact prices.
What are the main macroeconomic releases that impact on Natural Gas Prices?
The main economic release influencing Natural Gas prices is the weekly inventory bulletin from the Energy Information Administration (EIA), a US government agency that produces US gas market data. The EIA Gas bulletin usually comes out on Thursday at 14:30 GMT, a day after the EIA publishes its weekly Oil bulletin. Economic data from large consumers of Natural Gas can impact supply and demand, the largest of which include China, Germany and Japan. Natural Gas is primarily priced and traded in US Dollars, thus economic releases impacting the US Dollar are also factors.
How does the US Dollar influence Natural Gas prices?
The US Dollar is the world’s reserve currency and most commodities, including Natural Gas are priced and traded on international markets in US Dollars. As such, the value of the US Dollar is a factor in the price of Natural Gas, because if the Dollar strengthens it means less Dollars are required to buy the same volume of Gas (the price falls), and vice versa if USD strengthens.