USD/JPY
USDJPY157.691JPY
Today
-0.17%
1 Week
+0.03%
1 Month
+3.12%
6 Months
-1.83%
Year to Date
+11.96%
1 Year
+11.32%
Key Data Points
Opening Price
157.866Previous Closing Price
157.955Indicators
The Indicators feature provides value and direction analysis for various instruments under a selection of technical indicators, together with a technical summary.
This feature includes nine of the commonly used technical indicators: MACD, RSI, KDJ, StochRSI, ATR, CCI, WR, TRIX and MA. You may also adjust the timeframe depending on your needs.
Please note that technical analysis is only part of investment reference, and there is no absolute standard for using numerical values to assess direction. The results are for reference only, and we are not responsible for the accuracy of the indicator calculations and summaries.
USD/JPY Trading Strategy

Trading Strategy
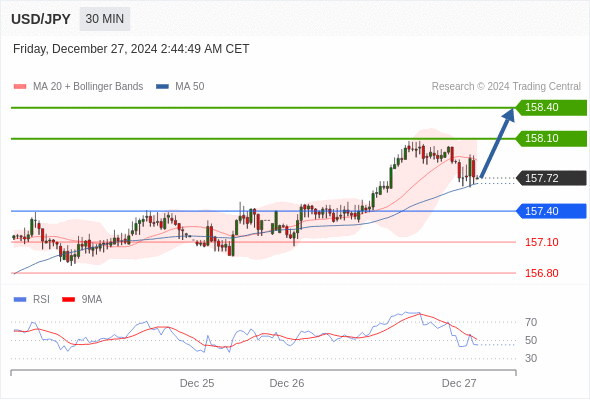
Long positions above 157.40 with targets at 158.10 & 158.40 in extension.
Alternative scenario
below 157.40 look for further downside with 157.10 & 156.80 as targets.
Comment
long positions above 157.40 with targets at 158.10 & 158.40 in extension.
USD/JPY News
FOREX-Yen hovers near 5-month low as BOJ's cautious stance weighs
By Kevin Buckland TOKYO, Dec 27 (Reuters) - The yen hovered near a five-month low to the dollar on Friday as the U.S. Federal Reserve's hawkish messaging contrasted with the Bank of Japan's cautious approach to further policy tightening.The yen traded at 157.725 per dollar JPY=EBS as of 0030 GMT,

USD/JPY holds below 158.00 after Tokyo CPI inflation data
The USD/JPY pair loses traction to near 157.75 during the early Asian session on Friday.

Japan Industrial Production (YoY) down to -2.8% in November from previous 1.4%
Japan Industrial Production (YoY) down to -2.8% in November from previous 1.4%

Japan Industrial Production (MoM) above expectations (-3.4%) in November: Actual (-2.3%)
Japan Industrial Production (MoM) above expectations (-3.4%) in November: Actual (-2.3%)

Japan Unemployment Rate meets forecasts (2.5%) in November
Japan Unemployment Rate meets forecasts (2.5%) in November

Asian currencies struggle, stocks mostly lower amid Fed rate outlook concerns
Dec 26 (Reuters) - Emerging Asian currencies were mostly lower against a resilient dollar and stock markets weaker on Thursday, as investors continued to focus on the Federal Reserve's rate cut path in a holiday-thinned trading week.
