Silver Price Forecast: XAG/USD struggles to sustain above $29 as Fed signals fewer rate cuts this year

Fxstreet
13 de jun de 2024 às 06:12
- Silver price appears to be failing to maintain trade above $29.00 as the Fed sees only one rate cut this year.
- US bond yields rise despite traders holding Fed rate-cut bets for September.
- Investors await the US PPI data for further action.
Silver price (XAG/USD) struggles to gain ground above the crucial support of $29.00 in Thursday’s early European session. The white metal weakens as the Federal Reserve’s (Fed) dot plot of the June meeting has indicated that policymakers see only one rate cut this year. A few policymakers also advocated for maintaining the current interest rate framework for the entire year as they are less confident about inflation declining to the desired rate of 2%.
The appeal for precious metals remains vulnerable even though Fed Chair Jerome Powell acknowledged that there is a slower progress in the disinflation process and the Consumer Price Index (CPI) data for May was cooler than expected.
Meanwhile, the US Dollar Index (DXY) has extended its recovery to 104.80 and 10-year US Treasury yields bounce back to 4.33% albeit the CME FedWatch tool shows that traders hold their bets for the Fed to reduce interest rates in the September meeting. Higher yields on interest-bearing assets increase the opportunity cost of holding an investment in non-yielding assets such as Silver.
Going forward, investors will focus on the US Producer Price Index (PPI) data for May, which will be published at 12:30 GMT. Annual headline PPI is estimated to have accelerated to 2.5% from 2.2% in April, with core reading growing steadily by 2.4%.
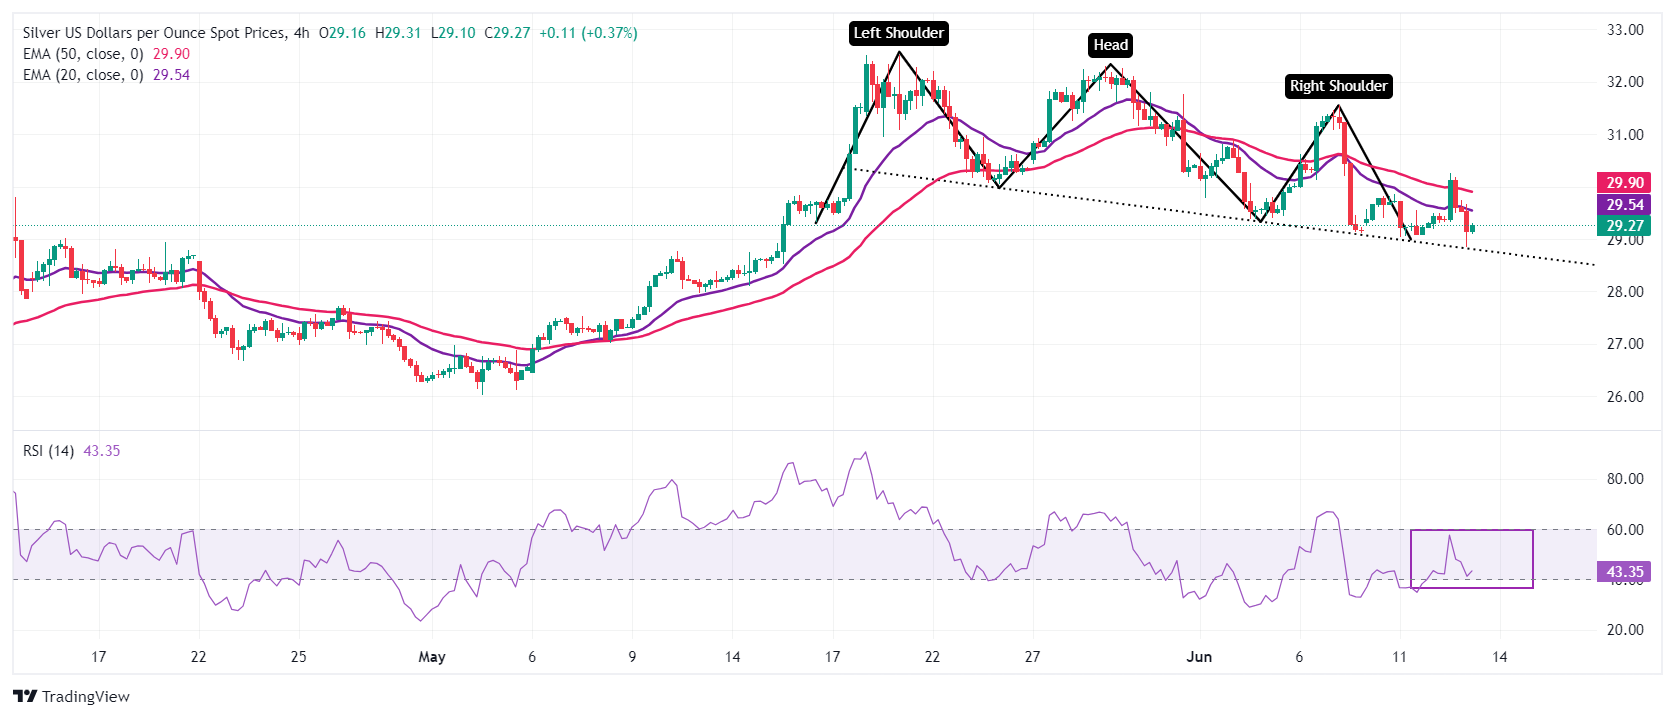
Silver technical analysis
Silver price will likely deliver a breakdown of the neckline of the Head and Shoulder (H&S) chart pattern, which is marked from May 24 low at $30.00 on a four-hour timeframe. A breakdown of the above-mentioned chart pattern results in a bearish reversal.
The near-term outlook remains uncertain as 20 and 50-day Exponential Moving Averages (EMAs) near $29.50 and $29.90, respectively, are declining.
The 14-period Relative Strength Index (RSI) hovers near 40.00. A bearish momentum would trigger if it breaks below the same.
Silver four-hour chart
Artigos relacionados
Ouro pode ter atingido o pico e sofrer forte correção, segundo analistas
Investing.com – Os analistas do RBC Capital Markets expressaram cautela em relação ao ouro, considerando-o supervalorizado após alcançar níveis recordes de
Binance Coin (BNB) dispara 18% em uma semana e atinge nível recorde
Investing.com – O Binance Coin (BNB), token da maior exchange de criptomoedas a nível global, apresenta alta de 18% em uma semana, alcançando novo patamar
Rali do bitcoin e ethereum está longe de acabar - CryptoQuant
Investing.com – Grandes investidores e institucionais impulsionaram os preços do bitcoin e do ethereum, provocando uma recuperação mais ampla do mercado. U

