Silver Price Forecast: XAG/USD holds $29 with eyes on US Inflation and Fed’s policy outcome

Fxstreet
12 de jun de 2024 às 10:48
- Silver price hovers above $29.00 ahead of eventful New York session.
- The US CPI data will be followed by the Fed’s policy, which will provide cues about when the central bank will return to policy normalization.
- Fed’s dot plot is expected to show fewer rate cuts than three forecasted in March.
Silver price (XAG/USD) steadies above its crucial support of $29.00 in Wednesday’s European session. The white metal is little changed ahead of the United States (US) Consumer Price Index (CPI) data for May and the Federal Reserve’s (Fed) interest rate decision, which are scheduled in the North American session.
Also, the US Dollar and bond yields pause as investors brace for crucial events. The US Dollar Index (DXY), which tracks the Greenback’s value against six major currencies, edges down to 105.20. 10-year US Treasury Yields steady near 4.40%.
Investors will pay close attention to the US inflation to know whether the progress in the disinflation process has resumed. The CPI data expectedly decelerated in April after remaining stubbornly higher in the first quarter of the year.
Meanwhile, the Fed is expected to remain status quo for the seventh straight time. The major trigger for global markets will be the Fed’s dot plot that indicates where policymakers see Federal fund rates heading in medium and longer-term timeframe.
The dot plot is expected to show fewer rate cuts this year from March’s forecast, given strong labor market conditions and weak confidence of officials on progress in the disinflation process.
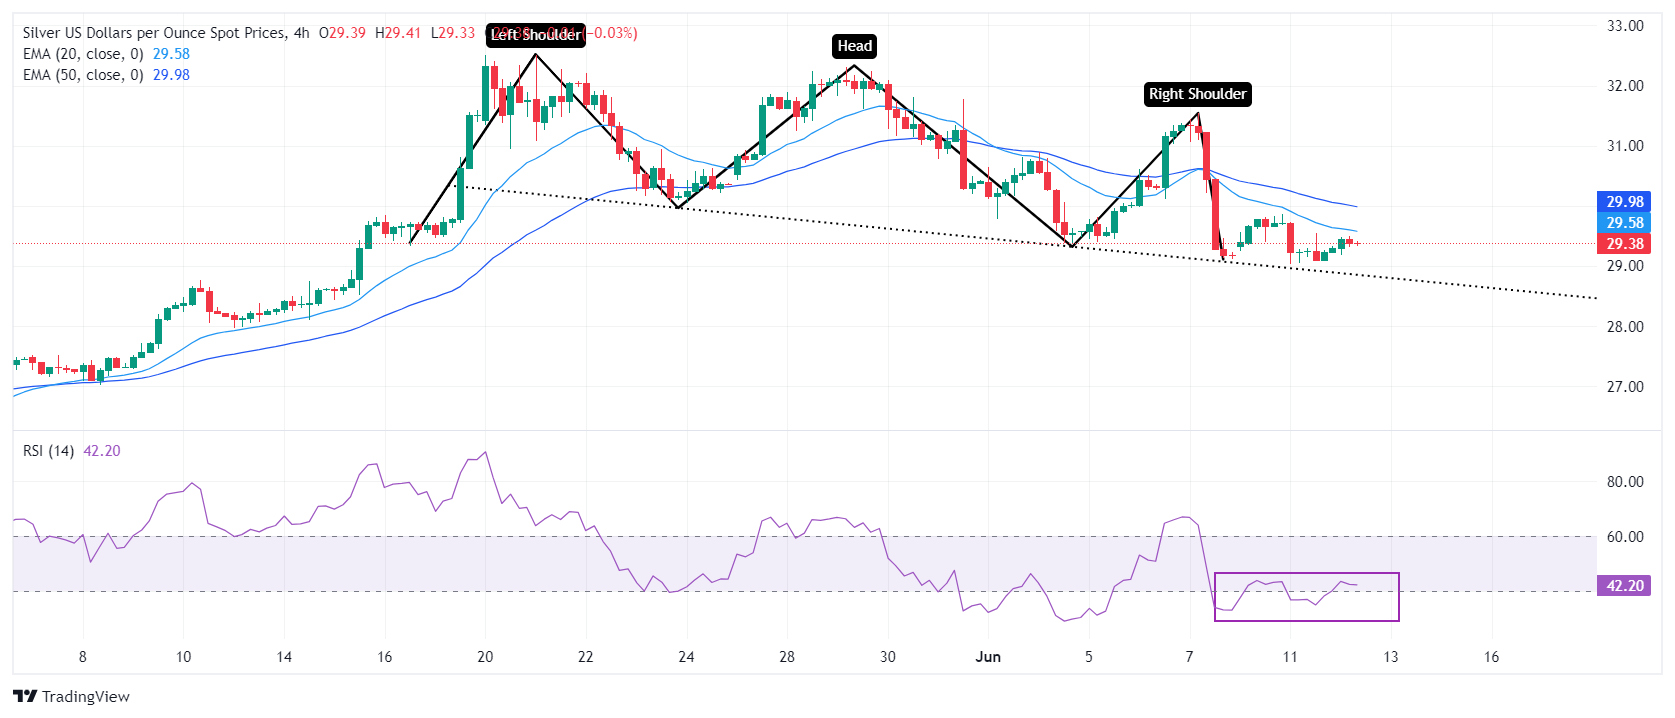
Silver technical analysis
Silver price trades inside Thursday’s trading range, exhibiting indecisiveness among market participants. The asset trades close to the neckline of the Head and Shoulder (H&S) chart pattern, which is marked from April 9 high at 1.0885 on a four-hour timeframe. A breakdown of the above-mentioned chart pattern results in a bearish reversal.
The near-term outlook remains uncertain as 20 and 50-day Exponential Moving Averages (EMAs) near $30.00 and $29.60, respectively, are declining.
The 14-period Relative Strength Index (RSI) hovers near 40.00. A bearish momentum would trigger if it breaks below the same.
Silver four-hour chart
Artigos relacionados
Ouro pode ter atingido o pico e sofrer forte correção, segundo analistas
Investing.com – Os analistas do RBC Capital Markets expressaram cautela em relação ao ouro, considerando-o supervalorizado após alcançar níveis recordes de
Binance Coin (BNB) dispara 18% em uma semana e atinge nível recorde
Investing.com – O Binance Coin (BNB), token da maior exchange de criptomoedas a nível global, apresenta alta de 18% em uma semana, alcançando novo patamar
Rali do bitcoin e ethereum está longe de acabar - CryptoQuant
Investing.com – Grandes investidores e institucionais impulsionaram os preços do bitcoin e do ethereum, provocando uma recuperação mais ampla do mercado. U

