

GBP/USD Price Analysis: Climbs above 1.2450 amid soft USD

- GBP/USD gains for a second consecutive day, influenced by halted US tariffs on Mexico and Canada.
- Technical stance remains bearish unless GBP/USD surpasses 1.2503 SMA and 1.2576 resistance.
- Sellers need to breach 1.2436 to reignite bearish momentum, potentially targeting lower supports.
The Pound Sterling (GBP) post gains versus the US Dollar (USD) for the second straight day after US President Donald Trump tariff threats on Mexico and Canada were delayed, due to negotiations beginning between the parties, aimed to improve fighting against fentanyl traffic and illegal migration. The GBP/USD trades at 1.2476 up 0.62%.
GBPUSD Price Forecast: Technical outlook
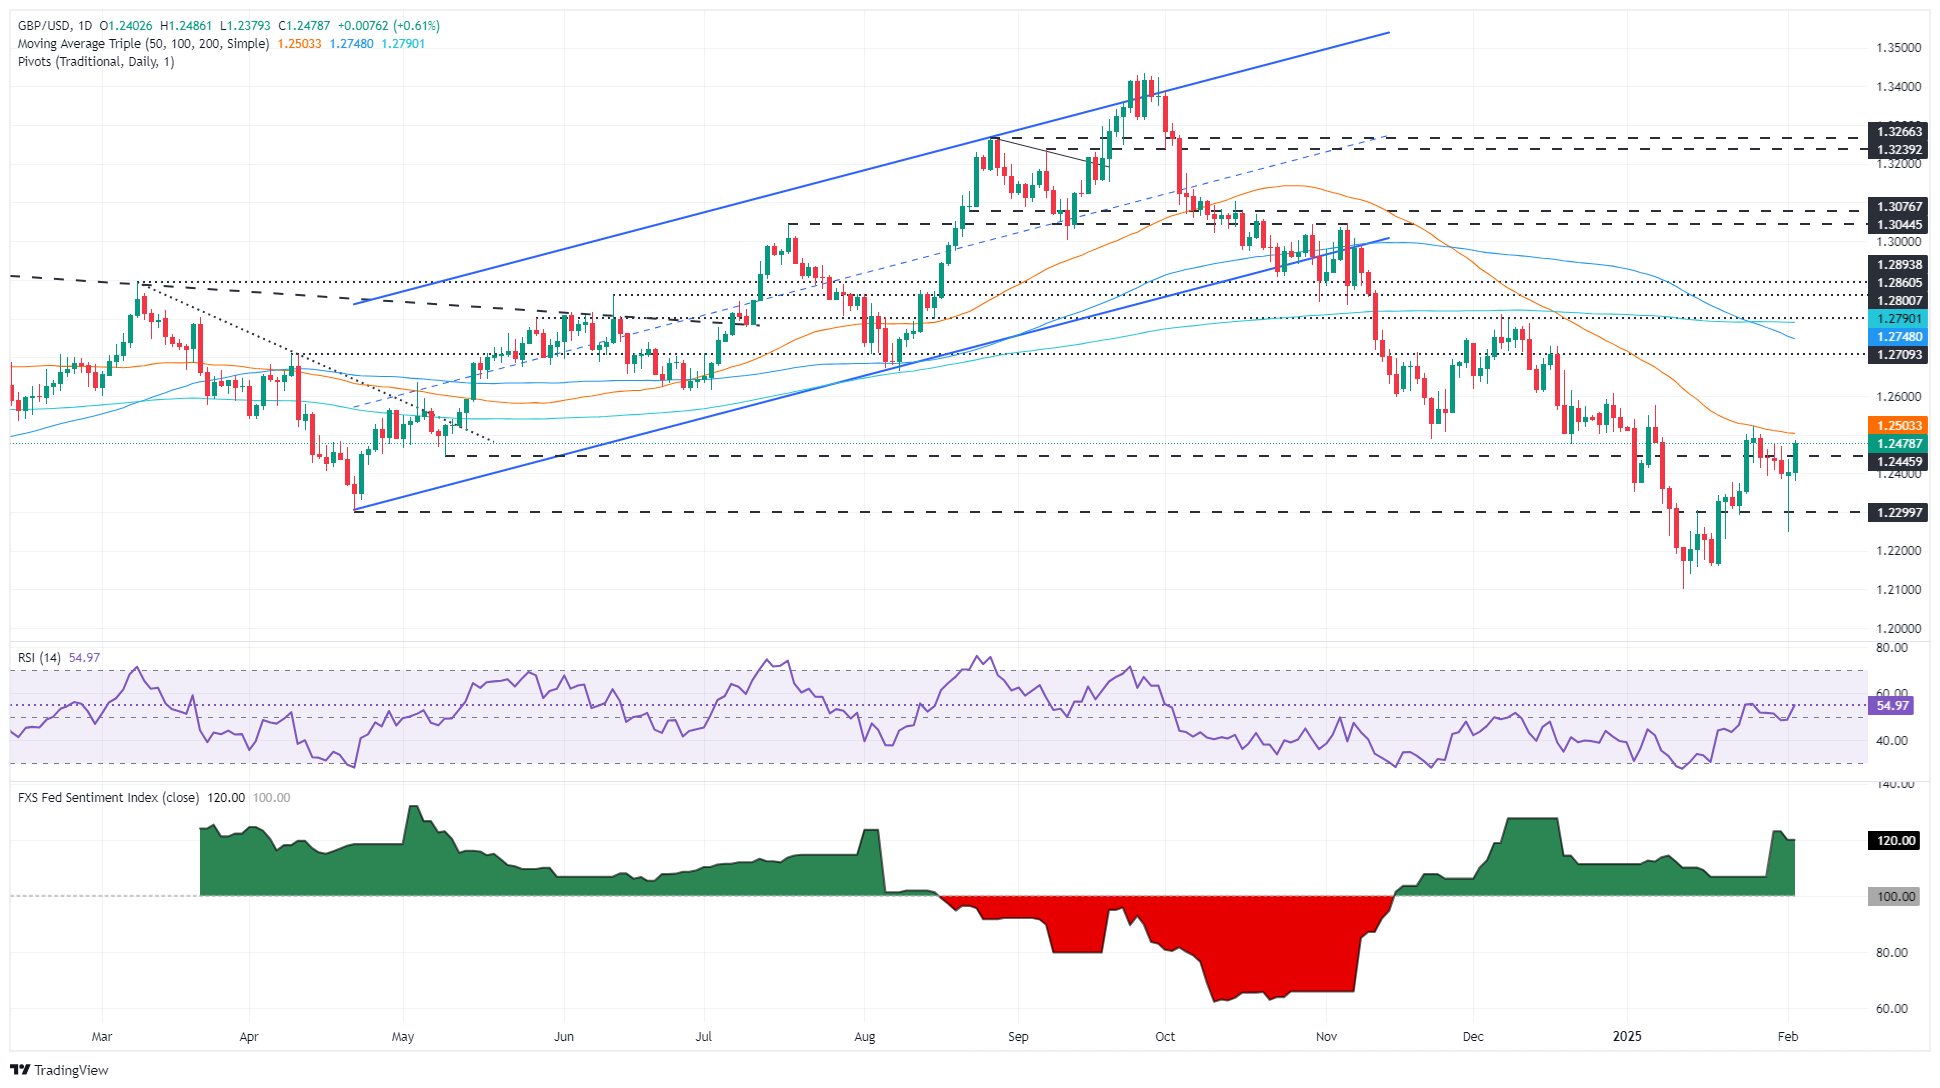
Despite extending its gains, the GBP/USD remains biased downward, unless buyers lift the pair above the 50-day Simple Moving Average (SMA) of 1.2503 and above the January 7 peak of 1.2576. Once that happens, the market would be in equilibrium, but with momentum skewed to the upside.
The Relative Strength Index (RSI) suggests that buyers are gathering momentum in the short term.
For a bearish continuation, the GBP/USD must drop below February 3 high of 1.2436, which would pave the way for challenging 1.2400. On further weakness the next support would be April 22, 2024 swing low of 1.2299.
GBPUSD Price Chart – Daily
British Pound PRICE Today
The table below shows the percentage change of British Pound (GBP) against listed major currencies today. British Pound was the strongest against the US Dollar.
| USD | EUR | GBP | JPY | CAD | AUD | NZD | CHF | |
|---|---|---|---|---|---|---|---|---|
| USD | -0.82% | -0.61% | -0.08% | -1.69% | -1.10% | -0.92% | -0.74% | |
| EUR | 0.82% | 0.23% | 0.74% | -0.88% | -0.28% | -0.10% | 0.09% | |
| GBP | 0.61% | -0.23% | 0.48% | -1.10% | -0.50% | -0.31% | -0.14% | |
| JPY | 0.08% | -0.74% | -0.48% | -1.58% | -0.99% | -0.82% | -0.62% | |
| CAD | 1.69% | 0.88% | 1.10% | 1.58% | 0.60% | 0.79% | 0.98% | |
| AUD | 1.10% | 0.28% | 0.50% | 0.99% | -0.60% | 0.18% | 0.40% | |
| NZD | 0.92% | 0.10% | 0.31% | 0.82% | -0.79% | -0.18% | 0.19% | |
| CHF | 0.74% | -0.09% | 0.14% | 0.62% | -0.98% | -0.40% | -0.19% |
The heat map shows percentage changes of major currencies against each other. The base currency is picked from the left column, while the quote currency is picked from the top row. For example, if you pick the British Pound from the left column and move along the horizontal line to the US Dollar, the percentage change displayed in the box will represent GBP (base)/USD (quote).
Related Articles
Coca Cola (KO) Q4 Earnings Preview: Look for the Upside in the AI Initiatives, not in the Revenue and the EPS
Coca-Cola (KO) enters its fourth-quarter 2025 earnings call tomorrow with significant momentum. However, a fundamental shift is occurring.
Warsh’s Fed Era Signals a Death Knell for QE, Jolting the $30 Trillion Treasury Market
With Warsh’s nomination, his past proposals for governing the Federal Reserve are being brought to the forefront. A central issue is the formulation of a new "1951 Accord" to restructure the relationship between the Fed and the Treasury. Analysts suggest such a move could impact the $30 trillion Tre
Amazon Stock Predictions for 2026 to 2030: Will They Exceed Expectations and Achieve Major Long-Term Goals?
TradingKey - As we head into 2026, many investors are questioning where Amazon (AMZN) fits into the technology world.
A Crash After a Surge: Why Silver Lost 40% in a Week?
TradingKey - Spot silver (XAGUSD) prices continue to decline. Silver plunged 20% on Thursday, breaking below $71 per ounce, with the sell-off intensifying on Friday as prices fell further below $64. Compared to the all-time high set on January 29, silver prices have retraced more than 40%, wiping out nearly all gains accumulated over the previous month.

